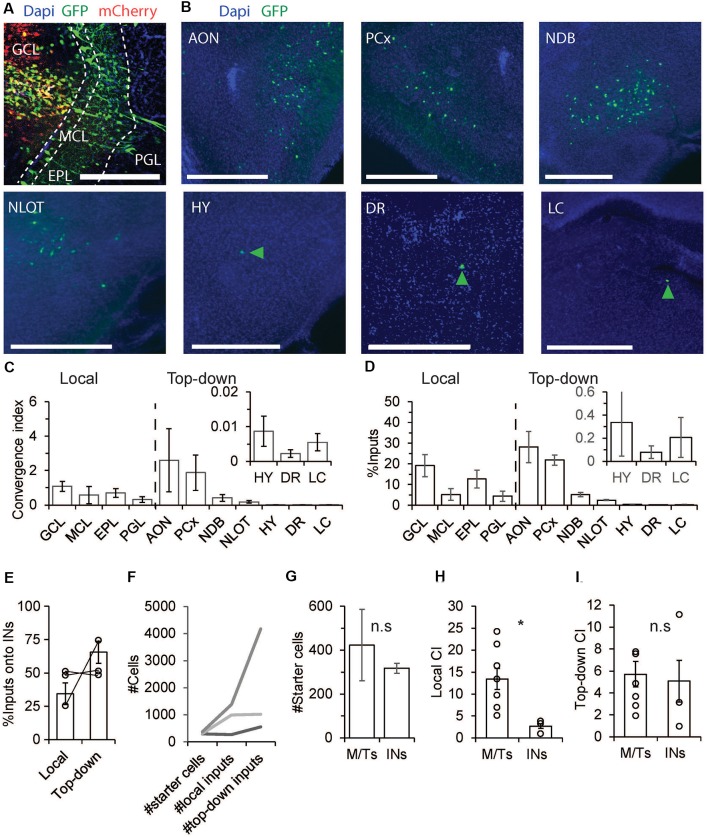
Figure 3.
The pre-synaptic landscape of INs. (A–F) Same as Figures 2B–G but for GAD-cre mice. Unlike M/Ts, INs have more inputs from top-down sources. (G) M/Ts and INs had similar number of starter cells (p > 0.05, Wilcoxon rank-sum test). (H) INs had significantly lower CI levels from local inputs as compared to M/Ts (p < 0.05 Wilcoxon rank-sum test). (I) INs and M/Ts receive comparable inputs from top down brain regions (p > 0.05, Wilcoxon rank-sum test). *p < 0.05, n.s not significant.

