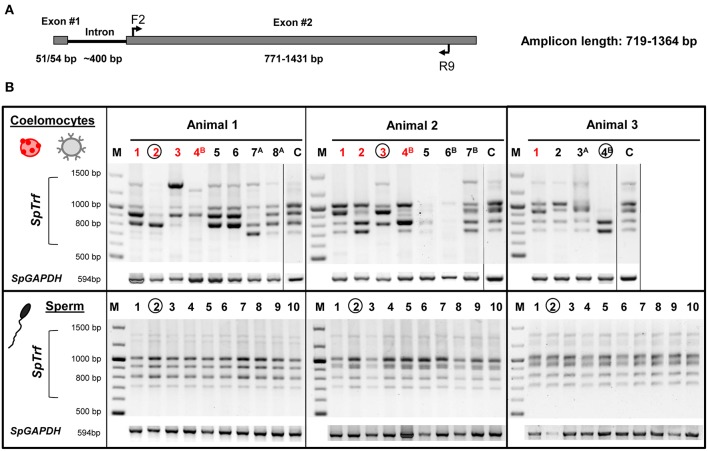
Figure 5.
The SpTrf gene family profile is different among single coelomocytes. (A) The standard structure of an SpTrf gene shows the locations of F2 and R9 degenerate primers that were used to amplify most of the second exon. This figure is modified from (6). (B) SpTrf gene amplification profiles from single coelomocytes and single sperm from three sea urchins that were processed for WGA. The upper panel shows the amplicon patterns from individual coelomocytes from three animals. Both single red spherule cells (red numbers) and single small phagocytes (black numbers) show variable sizes of the SpTrf gene amplicons. Circled lane numbers indicate samples for which amplicons were sequenced and include one coelomocyte and one sperm from each animal. Superscript letters associated with lane numbers indicate the time after immune challenge with Vibrio diazotrophicus: A, 1 day post challenge; B, 2 days post challenge. The controls (C) for each of the three sea urchins show amplicons from ~106 coelomocytes that were not processed for WGA. The lower panel shows the amplicon patterns of 10 single sperm cells from each animal. SpGAPDH is a single copy gene that was employed as the positive control for all samples to verify that genomic DNA after the WGA process would support PCR.

