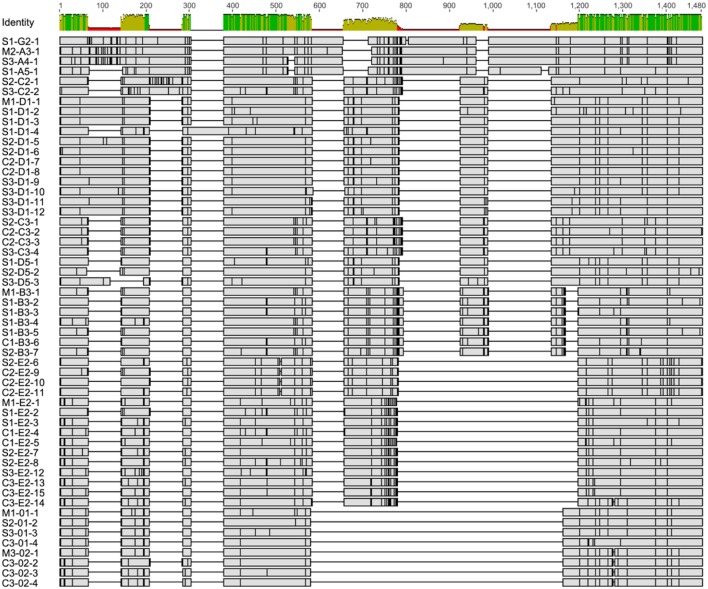
Figure 6.
The alignment of single cell derived SpTrf gene amplicon sequences indicate different element patterns and SNPs. All sequences were aligned using Bioedit software (46). The initial alignment was done with ClustalW on the deduced amino acid sequences, which was reverted to nucleotide sequences and optimized manually. The sequence identity level (percent identity) for each position is indicated at the top. Horizontal gray rectangles show regions of matching nucleotides in which SNPs are indicated as vertical black lines. Gaps are shown as black horizontal lines and indicate missing elements. Sequence names indicate source based on sperm (S), coelomocytes (C), or both (M), followed by element pattern, and sequence version number. Detailed alignment is presented in Figure S4.

