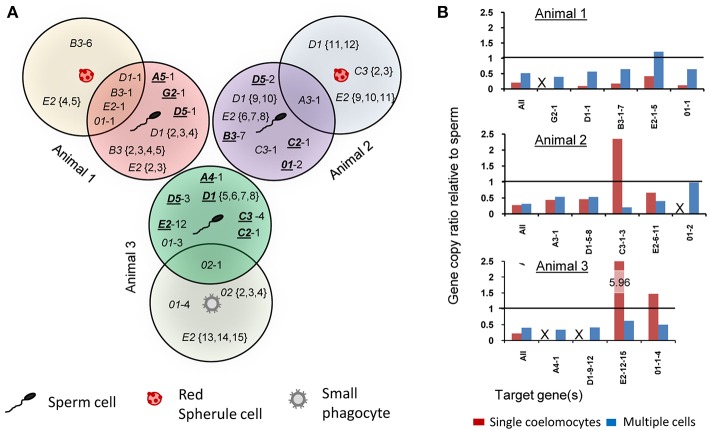
Figure 7.
Single cell analysis indicates somatic gene deletion, duplication, and sequence diversification in the SpTrf gene family. Amplicons of one coelomocyte and one sperm from each animal (as indicated in Figure 5B) were cloned and sequenced. (A) The Venn diagram illustrates shared and unique gene amplicons (element pattern followed by a sequence variant number after the dash) from single coelomocytes and single sperm from three animals. Underlined element patterns indicate gene sequences that are unique to sperm and are not found in coelomocytes for each animal. (B) qPCR results using primers that amplify the second exon of all SpTrf genes plus primers designed for specific gene sequences are shown as ratios of coelomocyte amplicons relative to sperm amplicons for each animal. Ratios of gene copy number between multiple coelomocyte and multiple sperm samples that were not processed for WGA are indicated in blue. Ratios of gene copy number between single coelomocyte and single sperm from the same animal (same cells as in A) are shown in red. The horizontal line represents a ratio of 1 (identical gene copy numbers between coelomocyte and sperm). Samples in which primers did not generate amplicons by qPCR are indicated with an X. See Table S2 for details.

