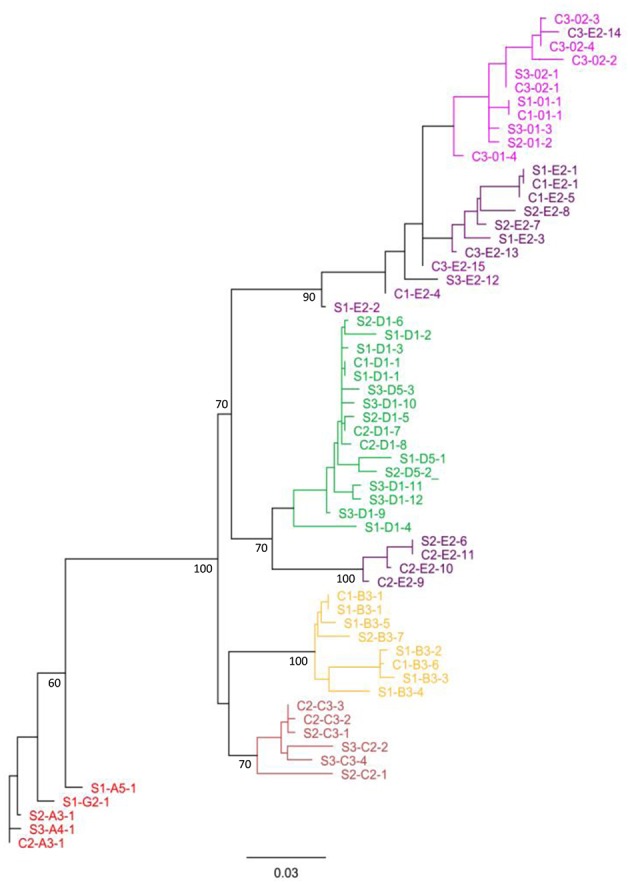
Figure 8.

Single cell SpTrf gene sequences cluster according to element patterns. The phylogenetic relationships of SpTrf amplicon sequences containing most of the second exon were inferred using maximum parsimony, neighbor joining (results not shown), and maximum likelihood, all of which gave similar results. The tree shown here is based on the maximum likelihood phylogeny with PhyML according to Jukes-Cantor model with 1,000 bootstrap replicates. Bootstrap values for nodes present in >50% of trees are shown. Sequences from sperm (S) or coelomocyte (C) are indicated accordingly and accompanied with animal number (1, 2, or 3). The letter and number after the first dash indicate the element pattern based on previously published nomenclature (7, 8, 16). The last number after the second dash indicates the sequence sub-categories based on SNP variations within an element pattern. Colors indicate the gene element pattern according to Miller et al. (7) and Buckley and Smith (8).
