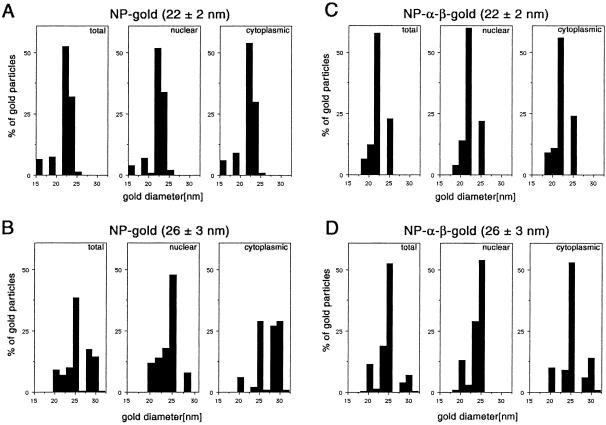
Figure 3.
Histograms on the size distribution of gold particles available for import (total), and found within the cytoplasm and the nucleus. Twenty-two ± 2 nm-gold particles, coated with NP (A), 26 ± 3 nm-gold particles, coated with NP (B), 22 ± 2 nm-gold particles, coated with NP and importin α and β (C), and 26 ± 3 nm-gold particles, coated with NP and importin α and β (D). For comparison, only 100 particles in the nucleus and 100 particles in the cytoplasm were measured. The data were derived from microinjections in four different oocytes.

