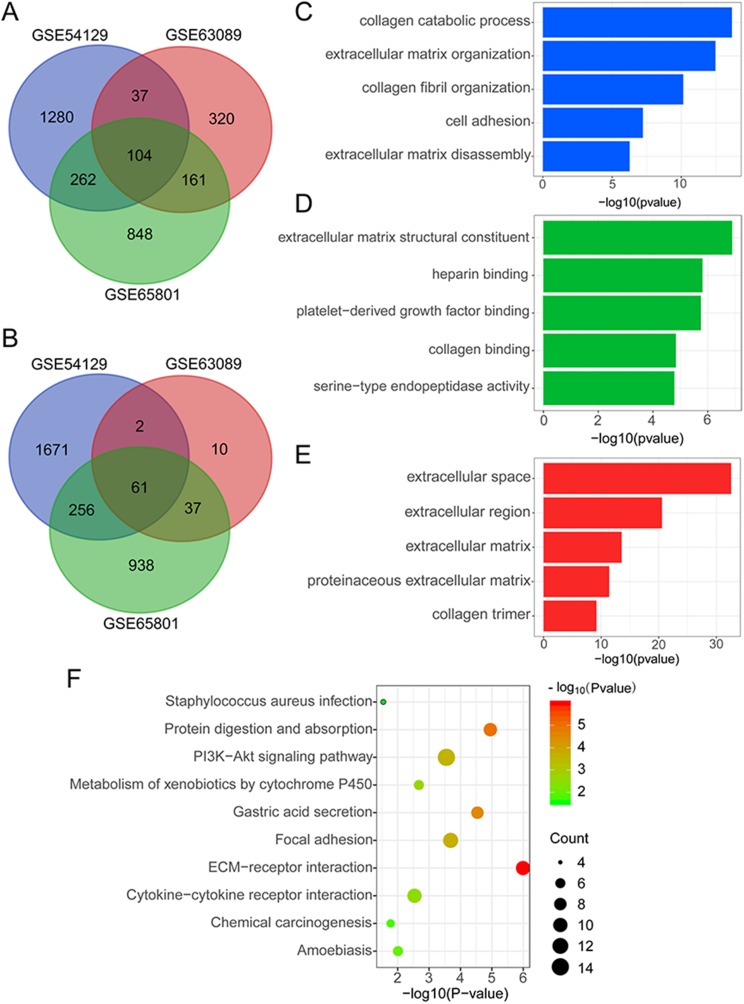
Figure 1. Screening and bioinformatic analysis of DEGs in GEO datasets.
(A) The venn graph of up-regulated DEGs in the GSE54129, GSE63089, and GSE65801 datasets. (B) The venn graph of down-regulated DEGs in the GSE54129, GSE63089, and GSE65801 datasets. The gene ontology analysis of DEGs, including (C) biological process (D) molecular function and (E) cellular component. (F) The KEGG enrichment analysis of DEGs in the GSE54129, GSE63089, and GSE65801 datasets.

