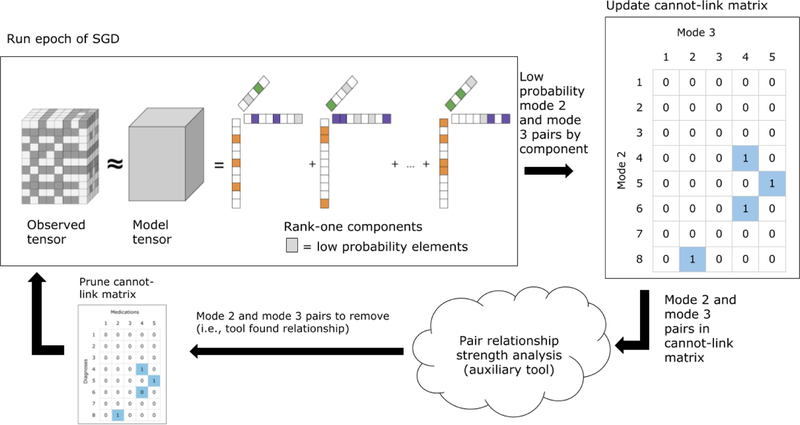
Figure 1.
A cartoon illustration of the CP-CLIC process. The outlined items represent an action being taken, while text above arrows represents data moving through the constraint matrix-building process. Starting in the upper lefthand corner, after an epoch of the CP-CLIC SGD fitting process is complete, CP-CLIC finds the elements in modes 2 and 3 of each component that have probabilities below a predetermined threshold. These (mode 2, mode 3) pairs are valued as a 1 in the cannot-link matrix. The pairs are evaluated using auxiliary information. If the auxiliary information finds there is a relationship, these pairs are removed from the cannot-link matrix.

