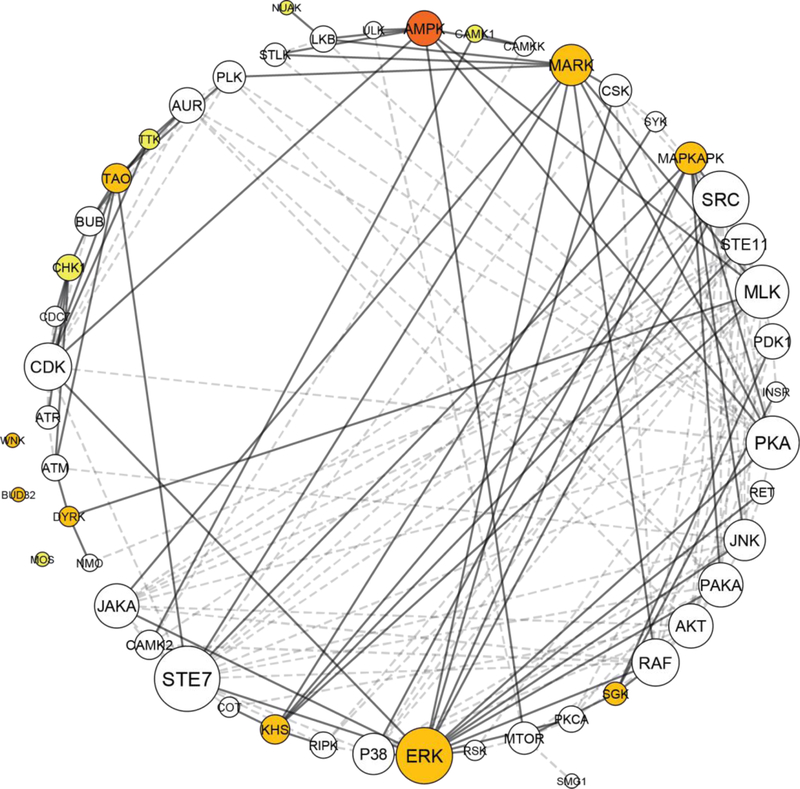
Fig. 6.
Kinase network dyregulation model of DISC1 schizophrenia. The kinase network was obtained by growing the kinome array hits with kinase interacting partners as identified using STRING. The kinome array hits are color coded, depending on the strength of association with DISC1 schizophrenia and the DISC1 mutation: dark orange indicates a kinome array hit identified in all 3 comparisons, orange a kinome array hit identified in 2/3 comparisons, and yellow a kinome array hit identified in 1/3 comparison (as depicted in the Venn diagram, Fig. 5). White circles represent indirect hits obtained after growing the network in STRING. Circle size corresponds to the number of interactions, with larger circles having more interactions. Thick lines represent interactions with a kinome array direct hit, while dashed lines represent interactions made between kinome array indirect hits. Kinase network model generated using Cytoscape ver. 3.6.1.

