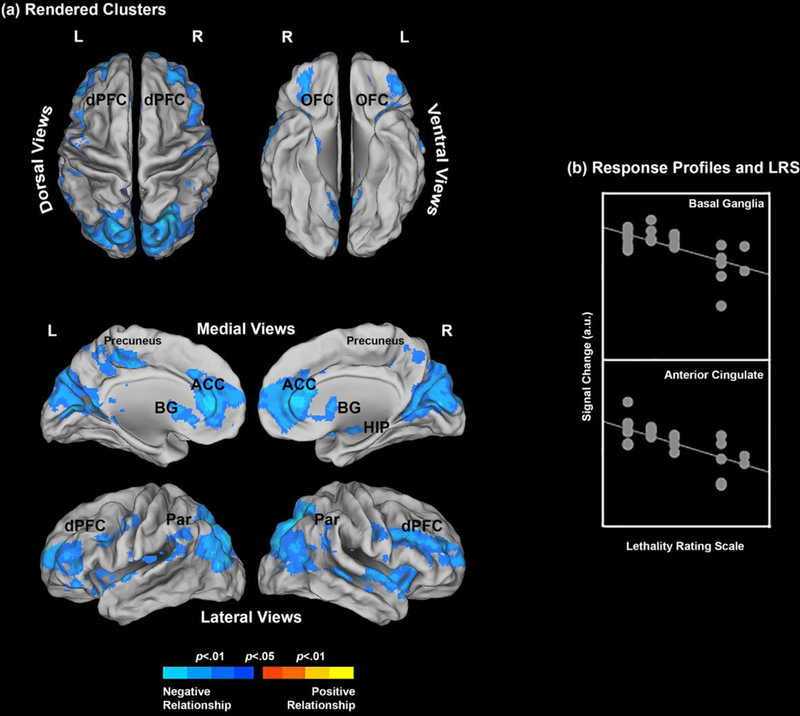
Figure 1.
(a) The clusters resulting from the underlying regression model show where the Lethality Rating Scale significantly predicts brain activation profiles. Results are depicted for the Negative > Neutral contrast (see Methods and Results) and the clusters are projected to dorsal, ventral, medial and lateral cortical surfaces. Only negative relationships were observed; That is, an increase in suicidality predicted a decrease in activation profiles under the Negative > Neutral contrast. The form of this relationship is explicated in (b) for the basal ganglia and the anterior cingulate (see Table 1 for peaks) where signal change is plotted against the LRS.

