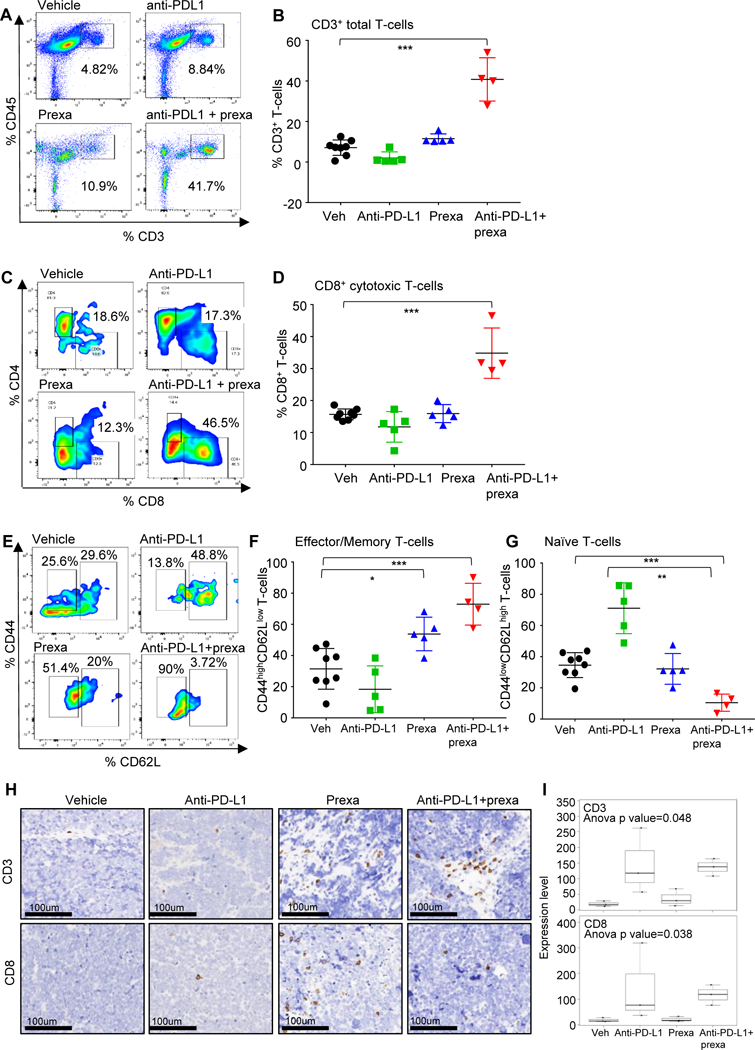
Figure 2: Analysis of immune infiltrates of tumors after CHK1i.

(A-H) SCLC tumors in Fig 1H were harvested at Day 21 and the immune profiling was analyzed by FACS at the endpoint, the representative plots and cumulative data for all the tumors is shown. FACS analysis of CD3+CD45+ Total T-cells (A-B), CD3+CD45+CD8+ cytotoxic T-cells (C-D), effector memory CD8 T cells: CD45+CD3+CD8+CD44highCD62Llow (E-F) and naïve T-cells CD45+CD3+CD8+CD44low CD62Lhigh (E, G) from the endpoint primary tumors. The statistical summary is shown with ANOVA test. ns, no significance; *, p < 0.05; **, p < 0.001; ***, p < 0.0001.
(H-I) The CD3 and CD8 IHC staining were performed in tumors from the resected tumors at Day 21 (from Fig 1H). Representative images of staining intensity are shown (H). The staining intensity and percentage of positive cells were analyzed and used to generate an H-score for each sample that passed quality control. Samples were stratified as CD3/8+ (+1, +2, +3), CD3/8- (0 and lower). The percent of each expression pattern of CD3 and CD8 IHC staining was summarized and shown in the bar chart (I).
