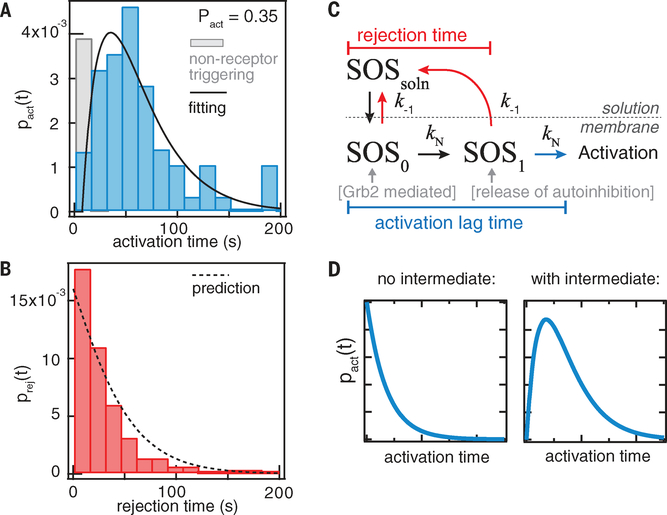
Fig. 2. Activation time distribution of SOS.
(A and B) Histograms of the activation time and rejection time of Grb2-mediated SOSFL recruitment from the single-molecule activation assay. The solid line is fitting to the model in (C); the fitted values are kN = 0.02 s−1 and k−1 = 0.016 s−1. The dashed line represents the prediction by the model using fitted values from the activation time distribution. (C) A simple model of SOSFL activation. kN denotes the transition rate constants for the kinetic intermediates, and k−1 represents the dissociation rate constants from membranes. SOSsoln, SOS in solution. (D) Without a kinetic intermediate (N = 0), the activation time distribution is an exponential distribution peaked at t = 0. In contrast, the existence of at least one intermediate produces the characteristic rise-and-decay shape for the activation time distribution.

