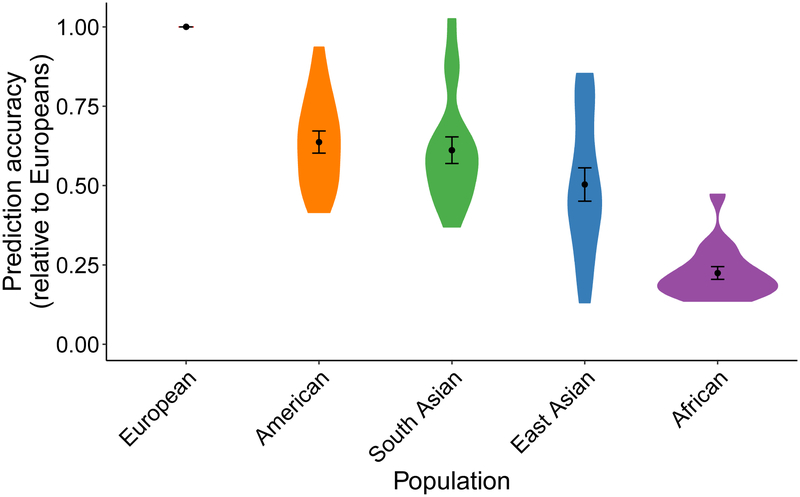
Figure 3. Prediction accuracy relative to European ancestry individuals across 17 quantitative traits and 5 continental populations in UKBB.
All phenotypes shown here are quantitative anthropometric and blood panel traits, as described in Supplementary Table 6, which includes discovery cohort sample sizes. Prediction target individuals do not overlap with the discovery cohort and are unrelated, with sample sizes shown in Supplementary Table 7. Violin plots show distributions of relative prediction accuracies, points show mean values, and error bars show standard errors of the means. Prediction R2 for each trait and population are shown in Supplementary Figure 12.

