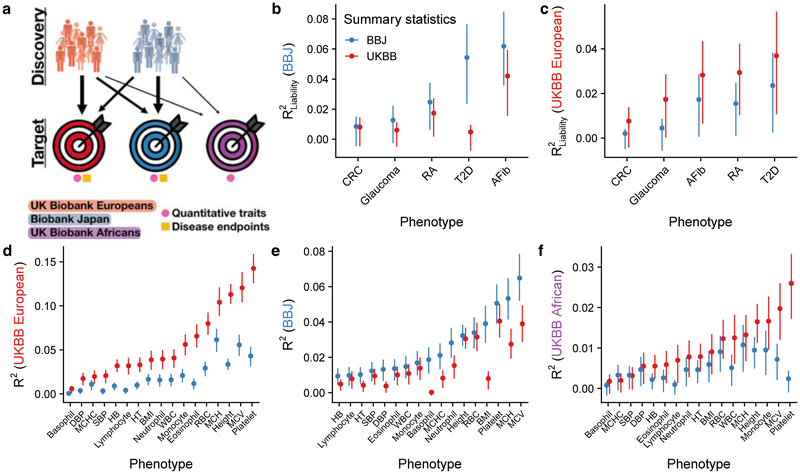
Figure 4. Polygenic risk prediction accuracy in Japanese, British, and African descent individuals using independent GWAS of equal sample sizes in the BioBank Japan (BBJ) and UK Biobank (UKBB).
a) Explanatory diagram showing the different discovery and target cohorts/populations, and disease endpoints versus quantitative traits. b–f) Genetic prediction accuracy computed from independent BBJ and UKBB summary statistics with identical sample sizes (Supplementary Tables 6 and 8). Note that y-axes differ, reflecting differences in prediction accuracy. b–c) PRS accuracy for five diseases in: Japanese individuals in the BBJ (b) and British individuals in the UKBB. d–f) PRS accuracy for 17 anthropometric and blood panel traits in: Japanese individuals in the BBJ (d), British individuals in the UKBB (e), and African descent British individuals in the UKBB (f). Trait abbreviations are as in Supplementary Table 6. Each point shows the maximum R2 (i.e. best predictor) across five p-value thresholds, and lines correspond to 95% confidence intervals calculated via bootstrap. R2 values for all p-value thresholds tested are shown in Supplementary Figures 2–6. Prediction accuracy tends to be higher in the UKBB for quantitative traits than in BBJ and vice versa for disease endpoints, likely because of concomitant phenotype precision and consequently observed heritability for these classes of traits (Supplementary Tables 2–4). Thalassemia and sickle cell disease are unlikely to explain a significant fraction of prediction accuracy differences for blood panels across populations, as few individuals have been diagnosed with these disorders via ICD-10 codes (Supplementary Table 9).

