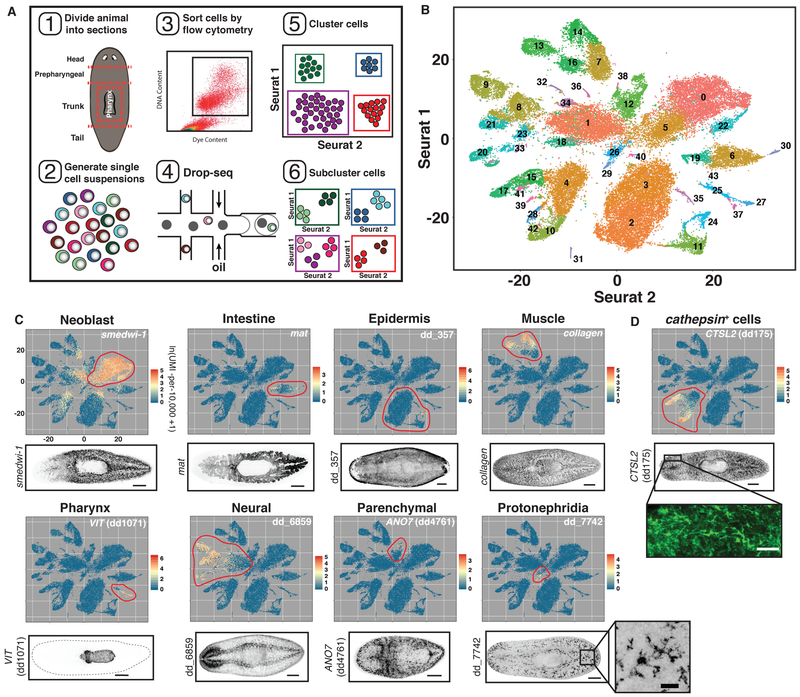
Fig. 1. Drop-seq of 50,562 planarian cells.
(A) Schematic illustrating the workflow used to isolate and cluster single cells. (B) t-SNE representation of 44 clusters generated from the data. (C and D) Top: t-SNE plots, colored by gene expression for highly enriched genes from 9 planarian tissue classes (Red to yellow to blue indicates high to medium to low expression). Red circles denote clusters assigned to that tissue class. Bottom: FISH images for tissue-enriched genes. Scale bars: whole-animal images, 200 μm; insets, 50 μm.

