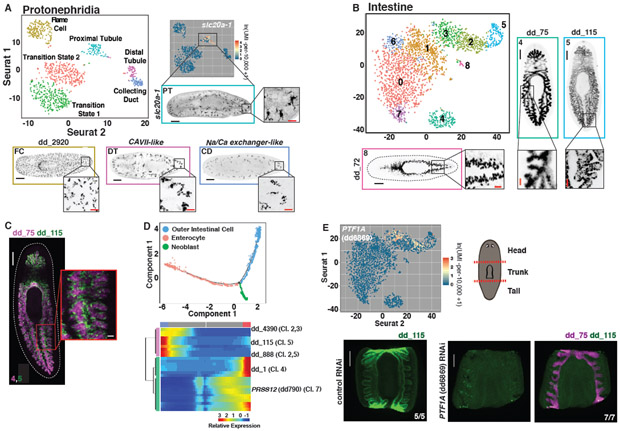
Fig. 3. Subclustering of tissues reveals transcriptomes for known and novel cell populations.
(A) t-SNE representation of the protonephridial subcluster. FISH images are labeled by their associated cluster. (B) t-SNE representation of intestinal subclusters. (C) Double FISH images of genes enriched in separate intestinal subclusters. Numbers indicate the associated subcluster for each marker. (D) Top: Cell trajectory of enterocyte and outer intestinal cell lineages produced by Monocle. Cells colored by identity. Bottom: Heat map of branch dependent genes (q-value < 1E-145) across cells plotted in pseudotime. Cells, columns; Genes, rows. Beginning of pseudotime at center of heatmap. “Cl.” annotation indicates a log-fold enrichment ≥ 1 of the gene in that intestine Seurat cluster. (E) Top left: Intestine t-SNE plot colored by expression of PTF1A (dd6869). Top right: Illustration of cutting scheme used to generate fragments. Bottom: dd_ 115 and dd_75 FISH of control and PTF1A (dd6869) RNAi animals. Animals cut and fixed 23 days following the start of dsRNA feedings. Scale bars: whole-animal/fragment images, 200 μm; insets 50 μm.

