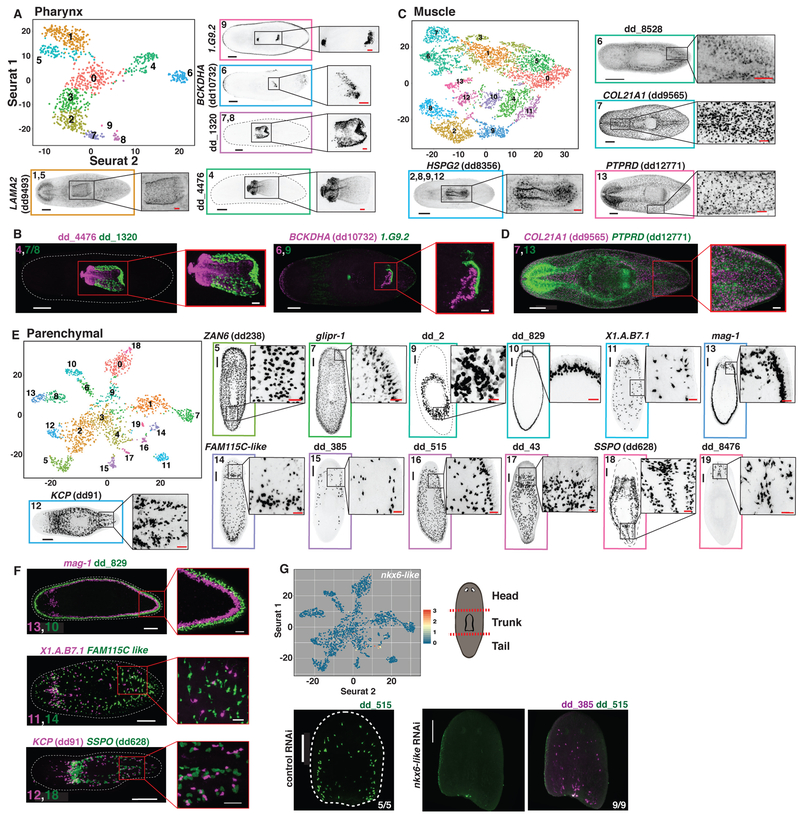
Fig. 5. Tissue subclustering identifies cell populations of poorly characterized tissues.
(A) t-SNE representation of the pharynx subcluster. FISH images are labeled by their associated cluster(s). (B) Double FISH images of pharynx markers enriched in separate subclusters. Numbers indicate the associated pharynx subcluster(s) for each marker. (C) t-SNE representation of the muscle subcluster. (D) Double FISH images of 2 muscle markers enriched in separate subclusters. Numbers indicate the associated muscle subcluster for each marker. (E) t-SNE representation of the parenchymal subcluster. (F) Double FISH images of 3 sets of parenchymal markers enriched in separate subclusters. Numbers indicate the associated parenchymal subcluster for each marker. (G) Top left: Parenchymal t-SNE plot colored by expression of nkx6-like. Top right: Illustration of cutting scheme used to generate fragments. Bottom: dd_515 and dd_385 FISH of control and nkx6-like RNAi animals. Animals cut and fixed 23 days following the start of dsRNA feedings. Scale bars: whole-animal/fragment images, 200 μm; insets, 50 μm.

