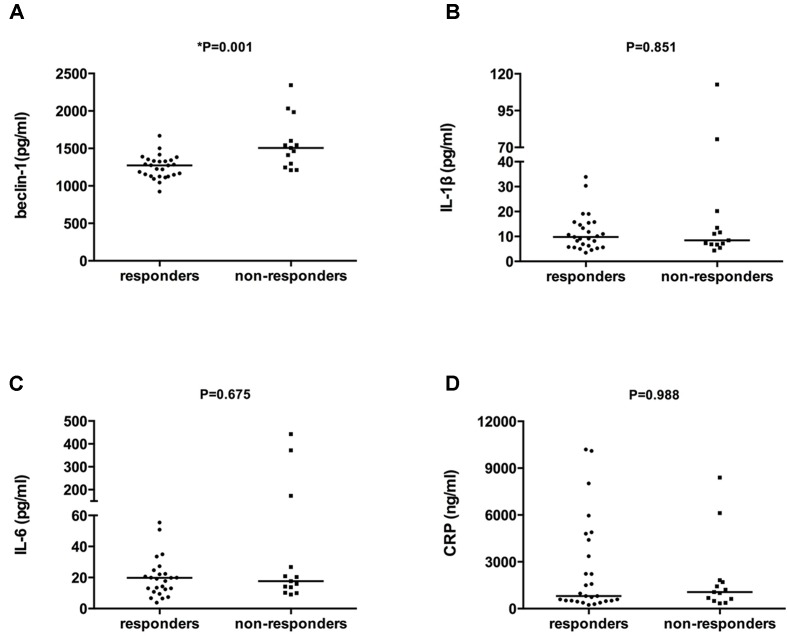
Figure 1.
Comparison of serum levels of beclin-1, IL-1β, IL-6, and CRP between antidepressant responders and non-responders at baseline. The bar represents the median. (A) Baseline serum beclin-1 levels of responders and non-responders, p = 0.001. (B) Baseline serum IL-1β levels of responders and non-responders. p = 0.851. (C) Baseline serum IL-6 levels of responders and non-responders, p = 0.675. (D) Baseline serum CRP levels of responders and non-responders, p = 0.988. All the comparisons between groups were performed using the Mann–Whitney U test.

