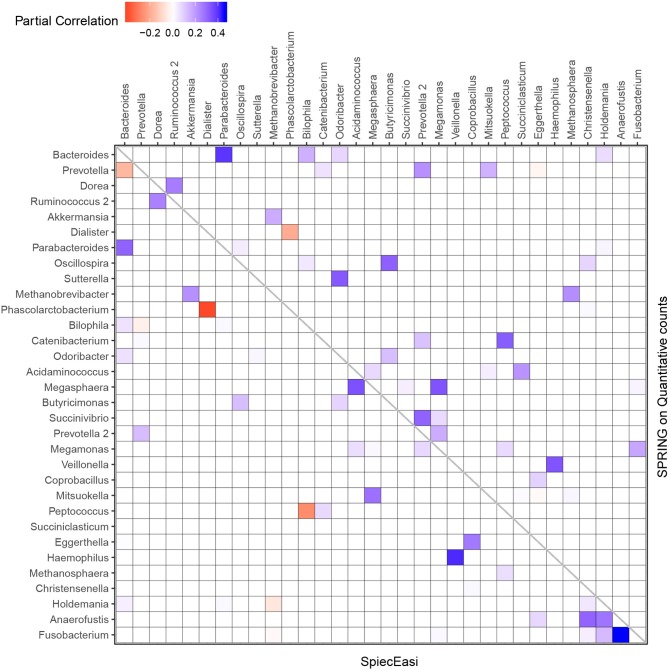
Figure 10.
Genus-genus association network using relative (lower triangular part) vs. quantitative count data (upper triangular part). Only genera with at least one strong association ≥ |0.2| in either SPIEC-EASI or SPRING are shown. The genera are ordered by the total quantitative abundance over healthy subjects (n = 106).

