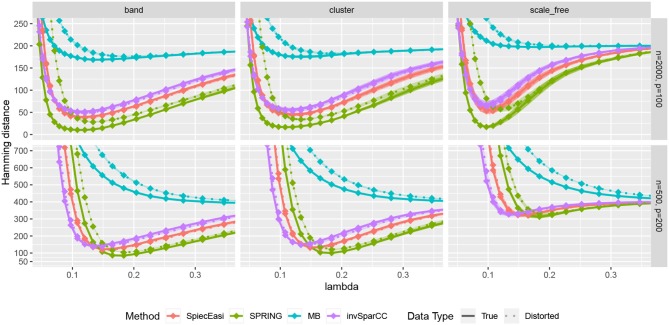
Figure 5.
Hamming distance as a function of tuning parameter λ. The lines correspond to mean values across 50 replications, and the bands show ± two standard errors. True abundance and distorted abundance data are distinguished by the transparency level and the line type: true data are less transparent and have solid lines; distorted data are more transparent and have dotted lines.

