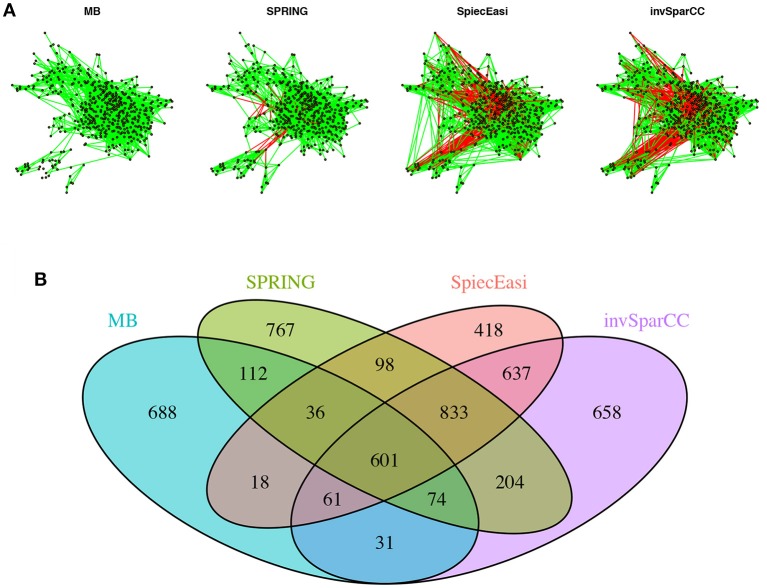
Figure 9.
Analysis of AGP data. (A) Force-directed layout (using igraph package in R) of the microbial association networks inferred by MB, SPRING, SPIEC-EASI, and invSparCC at StARS stability level 0.05. Green edges represent positive associations, red edges negative ones. (B) The four set Venn diagram showing the overlap of edge sets of the different association networks.

