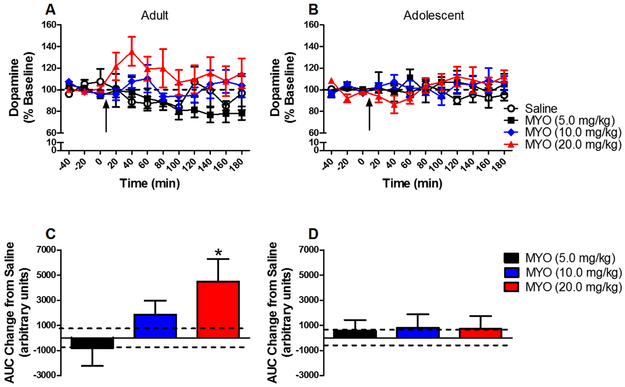
Figure 3:
Mean (± S.E.M.) dopamine concentration in NAc dialysate in adults (panel A) and adolescents (panel B) as a percent of baseline for each time point following administration of saline or myosmine (MYO) (n=10/group except adult saline n=11 and adolescent saline n=12). Arrow indicates time of injection. Dashed line represents baseline, expressed as 100%. Panels C and D show mean (± S.E.M.) area under the curve (AUC) in adults (panel C) and adolescents (panel D) following myosmine administration expressed as a change from saline. Dashed lines represent S.E.M. for saline. * indicates significant difference from saline control.

