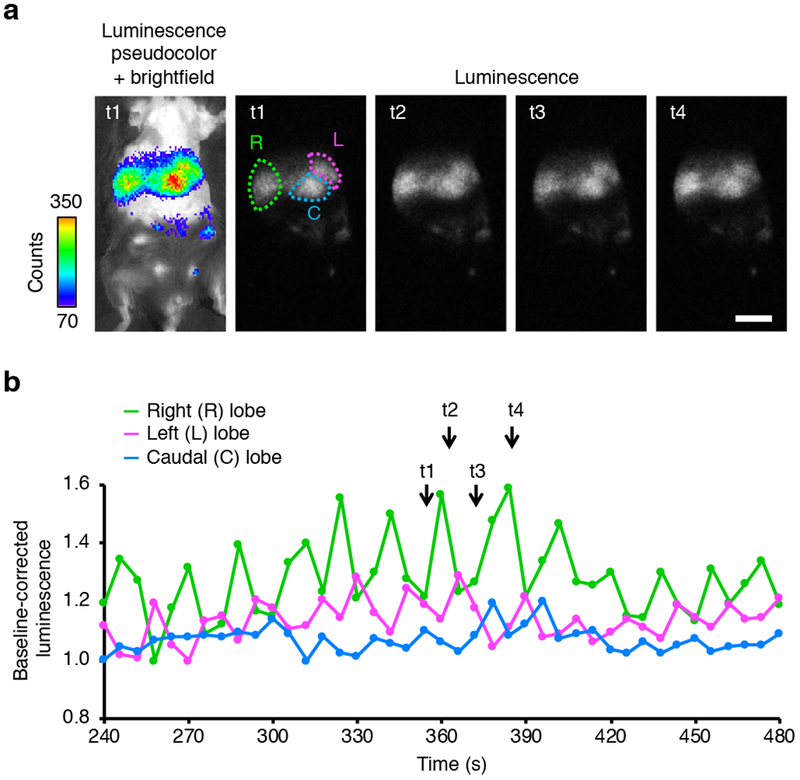
Figure 2. Non-invasive calcium imaging in the liver of a living mice with Orange CaMBI.

(a) A mouse transgenic for a floxed-stop Orange CaMBI 110 gene was injected with adeno-associated virus expressing Cre recombinase to activate gene expression in the liver. Raw bioluminescence images and overlay of pseudocolored bioluminescence signal over a bright-field image at the indicated time points t1 through t4. Color bar, linear lookup table relating pseudocolor to raw counts per pixel. Scale bar, 1 cm. (b) Time-course of bioluminescence of Orange CaMBI 110 from different lobes of mouse liver. Interspersed 2-s exposures of luminescence and bright field were acquired every 6 s. Integrated luminescence signal from each lobe normalized to its value at 150 s after substrate injection, when baseline luminescence stabilized, is shown. Normalization to a fitted second-order polynomial function was performed to correct for signal decay.
