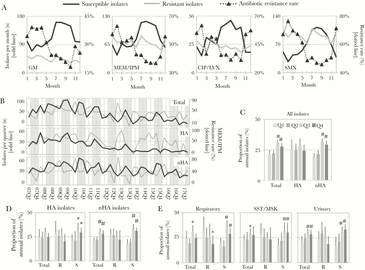
Figure 1.

Seasonality among antibiotic-susceptible, but not -resistant, Abc isolates. A, The cumulative total (solid lines, left axis) and antibiotic resistance rates (dotted lines, right axis) of isolates obtained in each month (1–12, January through December) over the study period. Graphs depict numbers of isolates that are susceptible (gray line) or resistant (black line) to each antibiotic or antibiotic class (GM, gentamicin; MEM/IPM, meropenem/imipenem; CIP/LVX, ciprofloxacin/levofloxacin; SMX, trimethoprim/sulfamethoxazole); B, Total, hospital-acquired (HA), and nonhospital-acquired (nHA) Abc cases per quarter (YY–QQ) are plotted with solid lines. Corresponding quarterly MEM/IPM resistance rates are plotted with dotted lines. Shaded areas highlight peaks in seasonal occurrence in Q3 and Q4. C,D,E, Average proportion of annual isolates occurring in each quarter, according to Abc subgroups. In panel C, isolates were grouped into total, HA, and nHA cases. In panels D and E, HA and nHA isolates (panel D) and isolates from each anatomical source (panel E), were grouped into total (all isolates with susceptibility data), MEM/IPM resistant (R) and susceptible (S) isolates. Color key for panels C–E is located in panel C. Error bars represent standard deviations. Multi-year averages for each quarter were compared to corresponding Q1 average by independent t test. *, P < 0 .05; #, P ≤ 0 .001.
