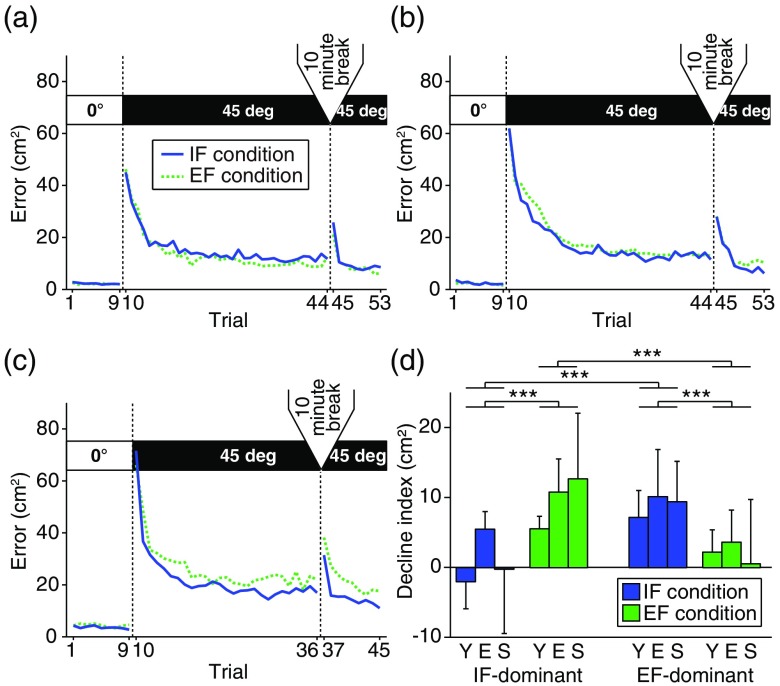
Fig. 4.
Learning curve in each group. (a)–(c) Movement errors in the (a) young, (b) elderly, and (c) stroke groups. Blue solid and green dotted lines indicate mean movement errors under the IF and EF conditions, respectively. In all groups, performance improved as trials progressed in the learning phase. After the 10-min break, the error increased and participants readapted to the same visuomotor rotation environment. (d) The degree of motor performance decline under IF and EF conditions. Labels “Y,” “E,” and “S” indicate the young, elderly, and stroke groups, respectively. Error bars denote the standard deviation. ***.

