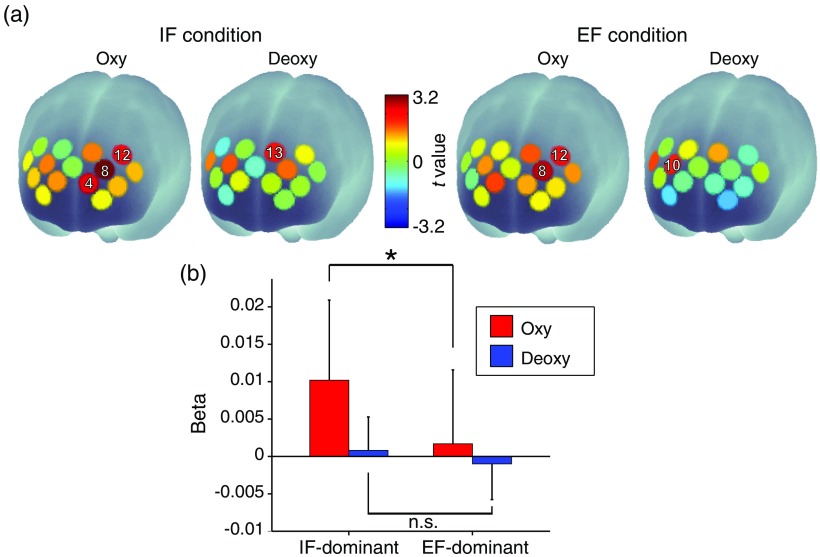
Fig. 6.
Spatial configuration in the prefrontal area reflecting individual optimal attentional strategy. (a) Only the beta value of oxy-Hb signal in ch.8 under the IF condition showed a significant difference between IF- and EF-dominant subgroups. (b) Beta values in ch.8 under the IF condition. The positive and negative values indicate an increase and a decrease in oxy-Hb/deoxy-Hb signals, respectively. The beta value of oxy-Hb signal in the IF-dominant subgroup was significantly larger than that in the EF-dominant subgroup (; -test, FDR-corrected). *.

