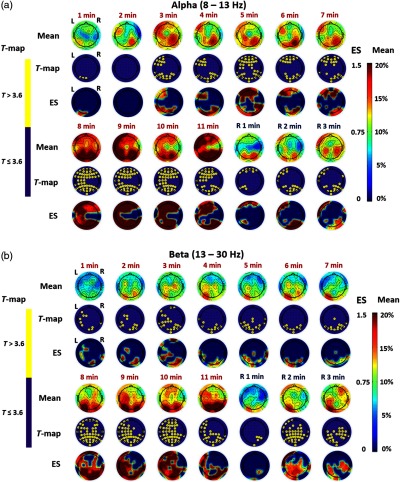
Fig. 4.
Time-resolved topographic maps of group-level differences in baseline-normalized EEG power density at (a) alpha and (b) beta bands between tPBM and sham experiments (i.e., ), corresponding statistical T-maps, and respective effect size maps, during the 11 min of tPBM/sham (T1, T2, … T11) and 3 min of recovery (R1, R2, and R3) periods. For both (a) and (b) panels, the color bar on the right side represents both the effect size (ES) and the mean difference in percentage increase of respective power density between tPBM and sham stimulations. The color bar on the left side represents the T-score cutoff for the Bonferroni-corrected -value (, which is equivalent to ) of significant differences in power density between tPBM and sham stimulations.

