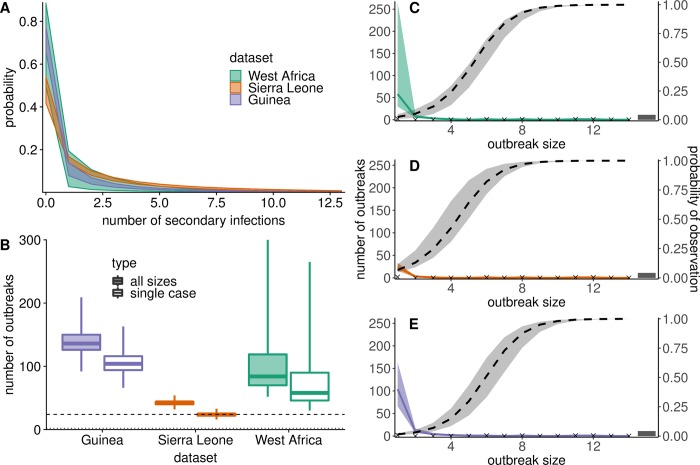
Fig 3.
A. Ranges of secondary infection distributions of all three datasets. B. Estimated numbers of all small outbreaks and spillover events (solid) and single-case spillover events (white) for each dataset. The dashed line indicates all observed EVD outbreaks and the dotted line indicates all observed single-case spillover events. C-E. Medians and ranges of estimated true (observed and unobserved) small EVD outbreaks by outbreak size for the full West African outbreak (C), Western Area, Sierra Leone only (D), and Conakry, Guinea only (E). The colored areas indicate ranges of from all 500 parameter sets. The dashed lines and grey areas indicate estimated probabilities of observing an outbreak of each size (median and full ranges from 500 parameter sets). Points marked with ‘X’ indicate the number of observed outbreaks of each size. Outbreaks of 15 cases or larger are pooled.

