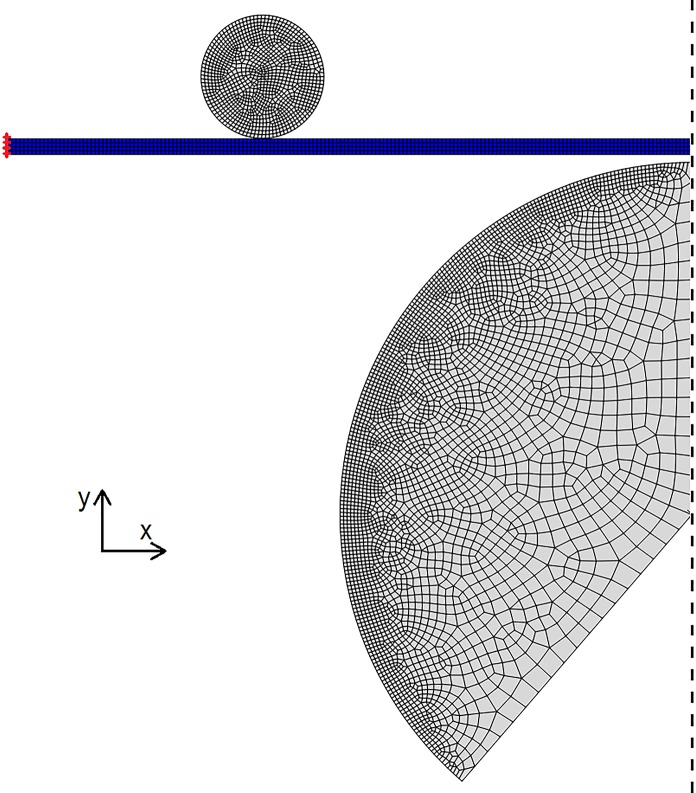
Fig 2. Finite element model of the testing procedure to investigate the stresses applied to the tissue and whether they are physiological.
Continuum elements are in blue and rigid bodies are in grey. The dashed line indicates a plane of symmetry and the red markers indicate the region where displacement boundary conditions were applied. The simulation consisted of two steps; the first used the larger spherical rigid body to deform the sample to the radius of curvature at the start of the in vitro testing. The elements on the left edge highlighted were fixed in the y direction but could move in the x direction to allow the tissue to be pulled over the larger contact body. The second step removed this contact body then applied the maximum pressure in the in vitro testing (260 mmHg) to the base of the in silico sample. Here the highlighted elements were then held in both directions to mimic the sample being pinned.

