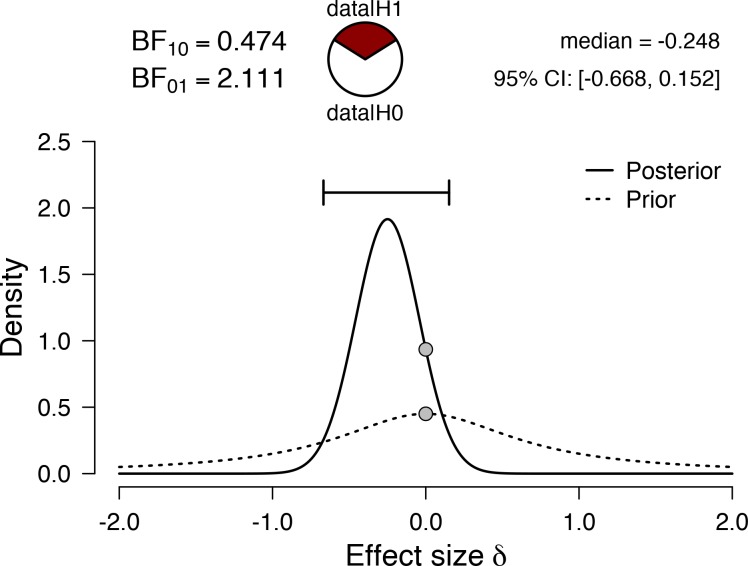
Fig 1. Prior and posterior effect size distributions, together with the effect size point estimate and associated 95% credible interval arising from a one-sample Bayesian t-test using a test value of 40.
The value of 40 represents the lower bound of the recommended training intensity zone. The resulting Bayes10 factor provides weak evidence for the alternative hypothesis. BF = Bayes factor.

