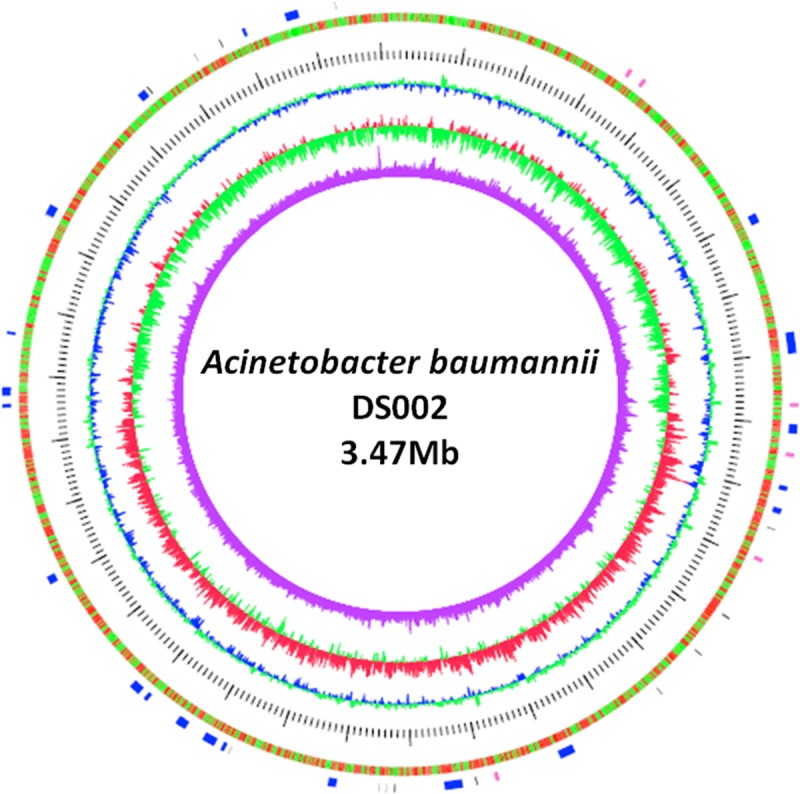
Fig 1. Circular map of the chromosome.

Circle 1 (outer to inner) represents the total 3251 CDS in the genome. Genes present on the positive and negative strands are depicted in red and green colour, respectively. Circles 3, 4 and 5 represent GC content, GC skew, and dinucleotide bias, respectively. The tRNA (black) and rRNA (red) coding genes and the genomic islands (blue) are shown in the outermost discontinuous circle.
