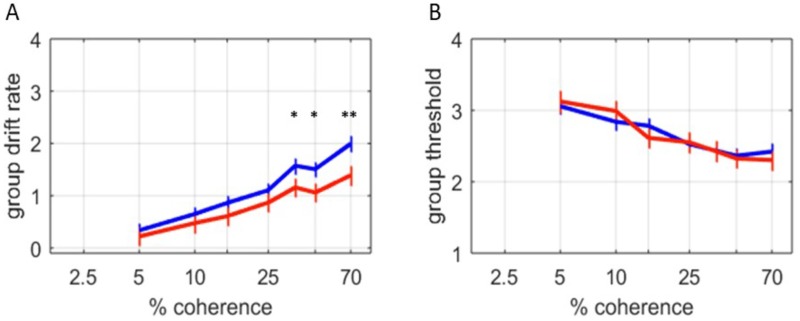
Fig 3. Behavioral task performance in OCD cases and controls.
A) A posterior distribution of group mean drift rate was calculated using HDDM, and indicates the rate of evidence accumulation over 7 different coherences. The most likely group means are plotted; error bars indicate the posterior standard deviation. With higher coherence, higher drift rates were observed for both OCD (red, n = 26) and control (blue, n = 44) subjects. However, at higher levels of coherence, OCD subjects exhibited significantly slower drift rates and reaction times than OCD subjects (q<0.05 for 30%, and 45% coherence; q<0.01 for 70% coherence). B) No significant differences in the posterior distribution of HDDM threshold were observed between OCD and control subjects.

