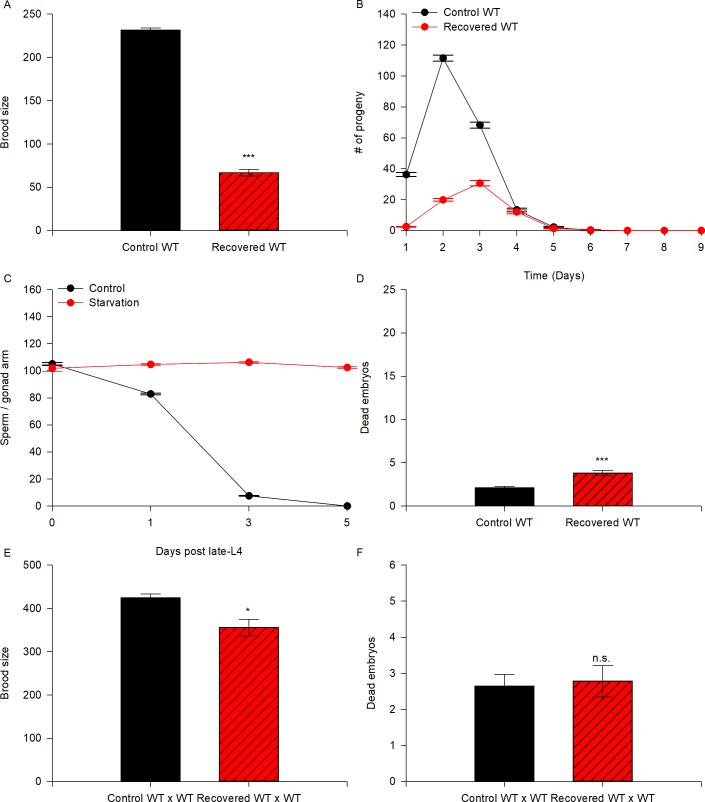
Fig 2. Animals subjected to ARD do not recover their fertility due to defects in germ cells.
(A) The graph represents the brood size produced by self-fertilizing control (black) and recovered (red) wild-type animals. Mid-L4 hermaphrodites were allowed to self-fertilize (black) or were starved for 5 days and then refed (red). The data represent the mean brood size (±SEM) per animal. Statistical significance was determined by the Student’s t-test (P ≤ 0.001). (B) Quantification of the progeny produced on each day by self-fertilizing control (black line) and recovered (red line) wild-type animals. Time-course data are displayed as the mean (±SEM) number of progeny per time point. (C) Quantification of sperm produced by wild-type animals under control conditions (black line) or subjected to ARD (red line) at several time points: the late-L4 larval stage and 1, 3 and 5 days after the mid-L4 larval stage. The data are displayed as the mean (±SEM) number of sperm per time point. (D) The number of dead embryos within the progeny of self-fertilizing wild-type animals under control (black) and recovered conditions (red) was calculated. Data represent the mean number of dead embryos (±SEM) per animal. Statistical significance was determined by the Mann-Whitney rank sum test (P ≤ 0.001). (E) The graph represents the brood size produced by mating control (black) and recovered (red) wild-type animals. Well-fed mid-L4 hermaphrodites were individually mated to 4 well-fed wild-type males overnight and were then transferred individually to fresh plates until they ceased laying eggs (black). For the recovered animals, mid-L4 hermaphrodites were starved for 5 days, then recovered on food and mated to 4 well-fed 1-day-old wild-type males overnight, then transferred individually to fresh plates until they ceased laying eggs (red). The data represent the mean brood size (±SEM) per animal. Statistical significance was determined by the Mann-Whitney rank sum test (P ≤ 0.024). (F) The number of dead embryos within the progeny produced by mating wild-type animals under control (black) and recovered conditions (red) to well-fed wild-type males was calculated. Data represent the mean number of dead embryos (±SEM) per animal. Statistical significance was determined by the Mann-Whitney rank sum test, and the difference was not significant (n.s.).

