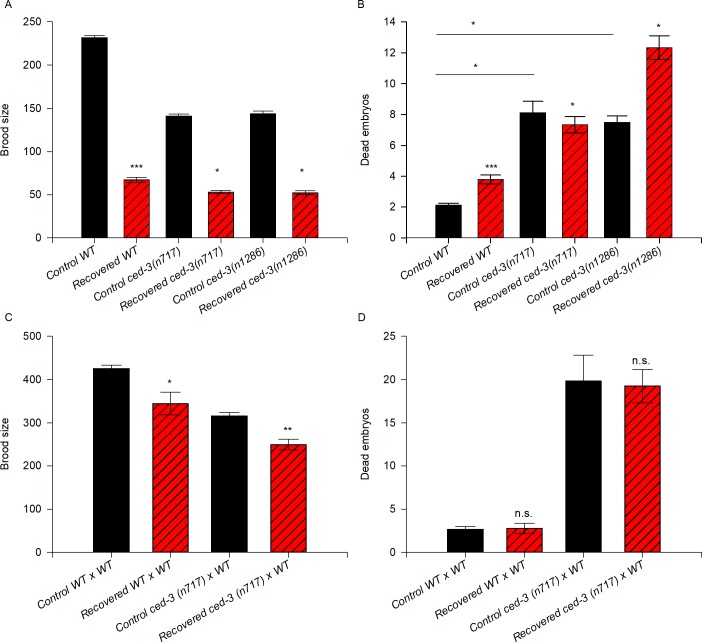
Fig 6. Apoptosis is as important to preserve oocyte quality after ARD as in control conditions but it is not essential for recovering fertility after ARD.
(A) The graph represents the brood size produced by control (black) and recovered (red) wild-type and ced-3 mutant animals. Mid-L4 hermaphrodites of the different genetic backgrounds were allowed to self-fertilize (black) or were starved for 5 days and then refed (red). The data represent the mean brood size (±SEM) per animal. Statistical significance was determined by the t-test (WT control vs. recovered) or by ANOVA on ranks and Dunn’s test for multiple comparisons. (B) The number of dead embryos within the progeny of self-fertilizing wild-type and ced-3 mutant animals under control (black) and recovered conditions (red) was calculated. The data represent the mean number of dead embryos (±SEM) per animal. Statistical significance was determined by the Mann-Whitney rank sum test (P ≤ 0.001) (WT control vs. recovered) or by ANOVA on ranks and Dunn’s test for multiple comparisons. (C) The graph represents the brood size produced by mating control (black) and recovered (red) animals of the different genetic backgrounds. Well-fed mid-L4 hermaphrodites were individually mated with 4 well-fed wild-type males overnight, then transferred individually to fresh plates until they ceased laying eggs (black). For the recovered animals, mid-L4 hermaphrodites were starved for 5 days, then recovered on food and immediately mated with 4 well-fed 1-day-old wild-type males overnight and transferred individually to fresh plates until they ceased laying eggs (red). The data represent the mean brood size (±SEM) per animal. Statistical significance was determined by the Mann-Whitney rank sum test (P ≤ 0.024) in wild-type populations and by the Student’s t-test (P ≤ 0.001) in ced-3(n717) populations. (D) The number of dead embryos within the progeny produced by mating animals of the different genetic backgrounds under control (black) and recovered conditions (red) to well-fed wild-type males was calculated. Data represent the mean number of dead embryos (±SEM) per animal. Statistical significance was determined by the Mann-Whitney rank sum test.

