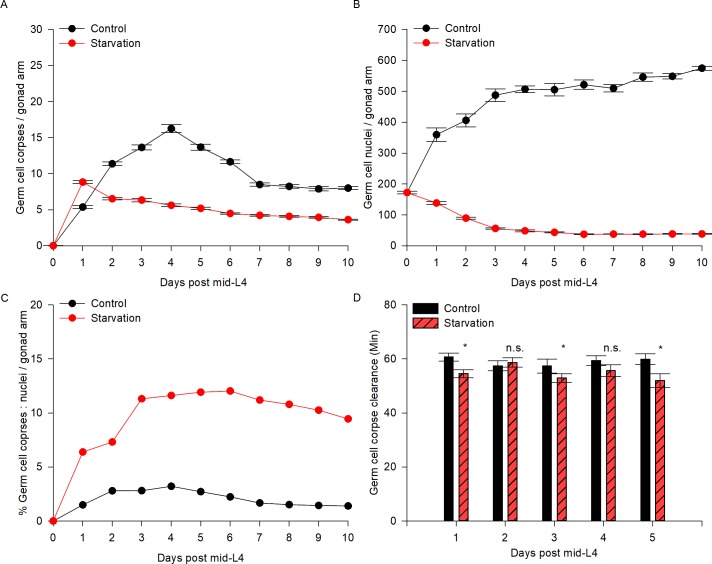
Fig 7. Germ cell apoptosis is increased and continues during ARD.
(A) The ced-1::gfp transgene was used to visualize the number of germ cell corpses per gonad arm (see Materials and methods) for 10 days in control (black line) and starvation conditions (red line). The average number of germ cell corpses per gonad arm is shown with SEM. (B) DAPI staining was used to quantify the number of germ cells per gonad arm (see Materials and methods) for 10 days in control (black line) and starvation (red line) conditions. The average number of germ cells per gonad arm is shown with SEM. (C) The percentage of germ cell corpses among the total germ cells per gonad arm in fed animals (black line) and during starvation (red line) was calculated. (D) The time of germ cell corpse clearance was recorded every day after 1–5 days post-mid-L4 (see Materials and methods) in control (black bars) and starvation (red bars) conditions.

