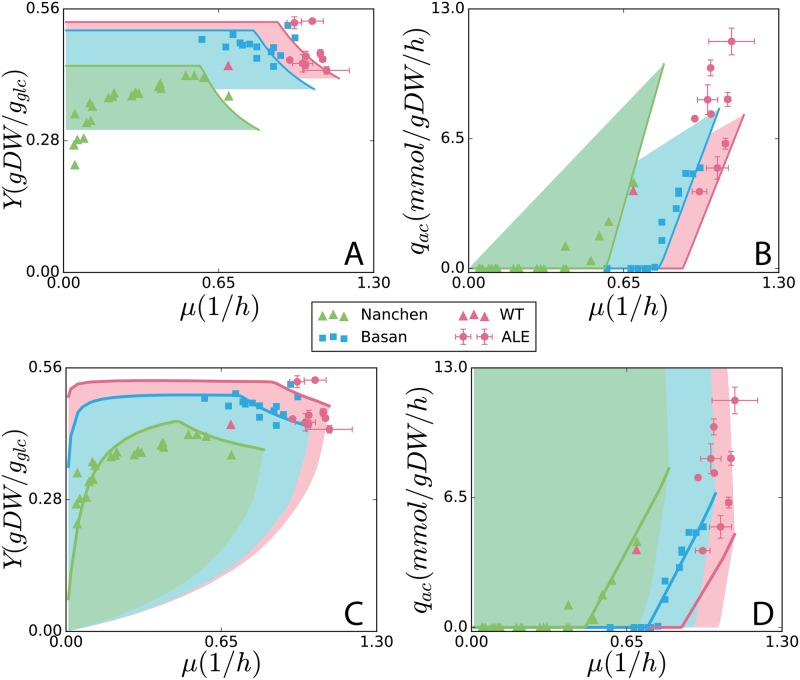
Fig 2. SSME-model and ME-model simulations.
Growth phenotypes of E. coli from simulations: (A, B) using the SSME-model and (C, D) ME-model. Simulations were fit to experimental data for each of the three datasets, K-12 MG1655 chemostat [8] (green triangles), NCM3722 substrate titration [5] (blue squares), and strains adapted from wild-type K-12 MG1655 (red triangle, [3] for maximum growth rate through ALE (this study, red circles, error bars for standard deviation across duplicates). The Y-maximized solutions are displayed as solid lines in all plots. Solution spaces are simulated by taking the feasible range between maximum (Ymax–Ymin in A and C, qac,max–qac,min in B and D)For both models, fitting was performed by manipulating three global parameters: unmodeled protein fraction (UPF), growth-associated maintenance (GAM), and non-growth associated maintenance (NGAM). Details of the fitting approach are provided in Materials and Methods.

