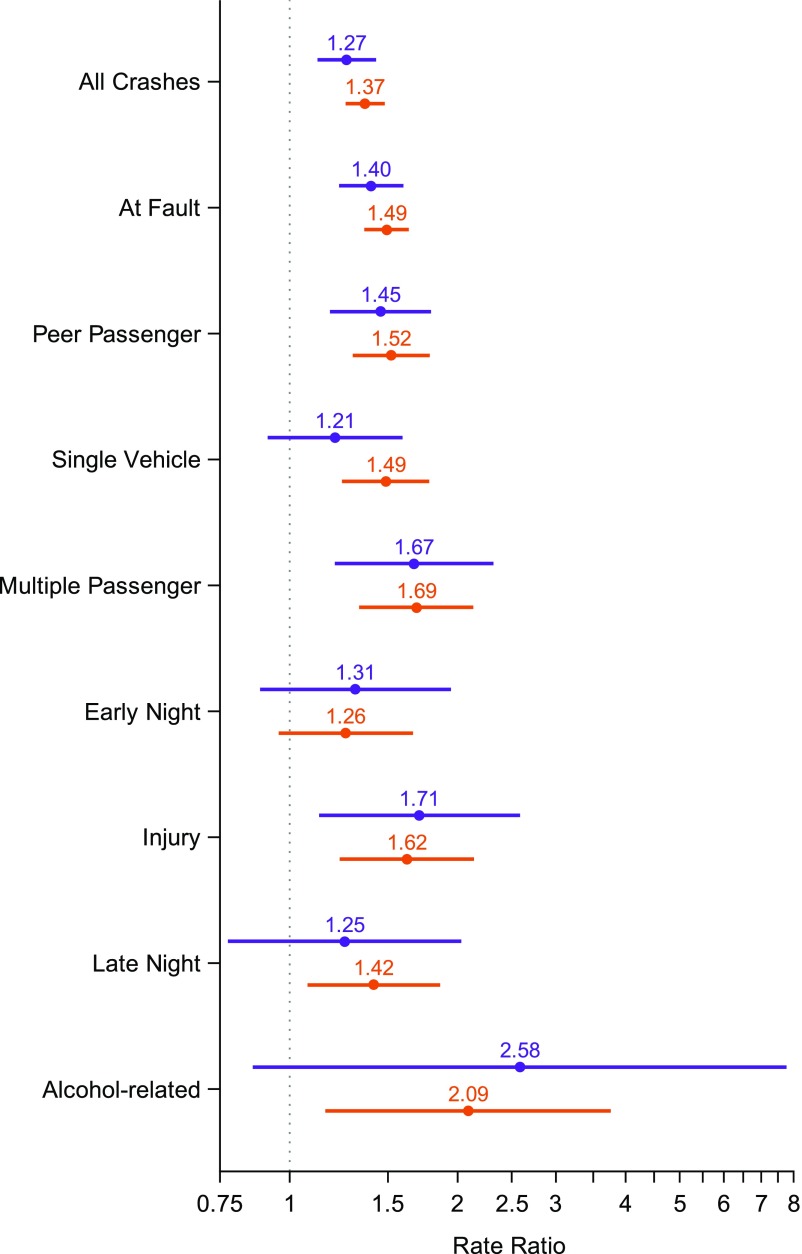
FIGURE 3.
AdjRRs and 95% CIs for crash outcomes; comparing drivers with and without ADHD. Dots indicate the estimated adjRR, and lines indicate the width of the 95% CI from repeated-measures Poisson regression models. Purple dots and lines compare outcomes for 12 months after licensure. Orange dots and lines compare outcomes for 48 months after licensure.

