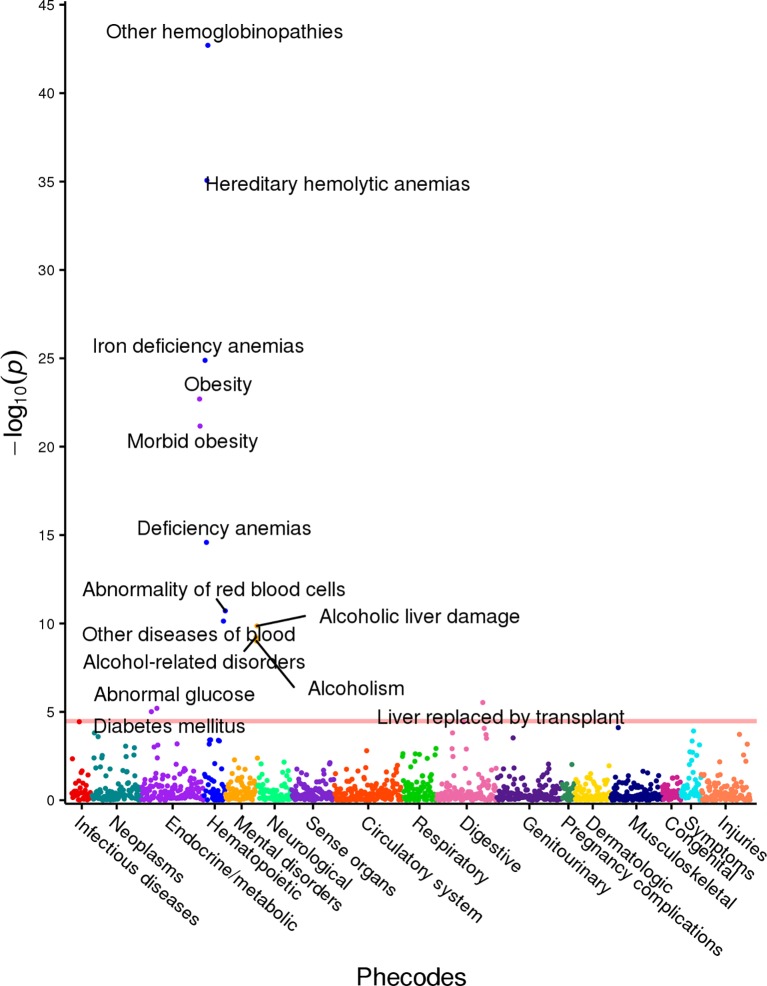
Fig 2. MCV PheWAS plot.
This figure illustrates the results of individual linear regression between incidence of phenotype groups (phecodes) and continuous MCV component measures. The model includes age, gender and ethnicity as covariates. Each point represents the p-value of the association between one of 1,488 phecodes with at least 20 cases assigned to it, and the MCV component measure. The horizontal red line represents the significance level p = 3.4x10⁻⁵.

