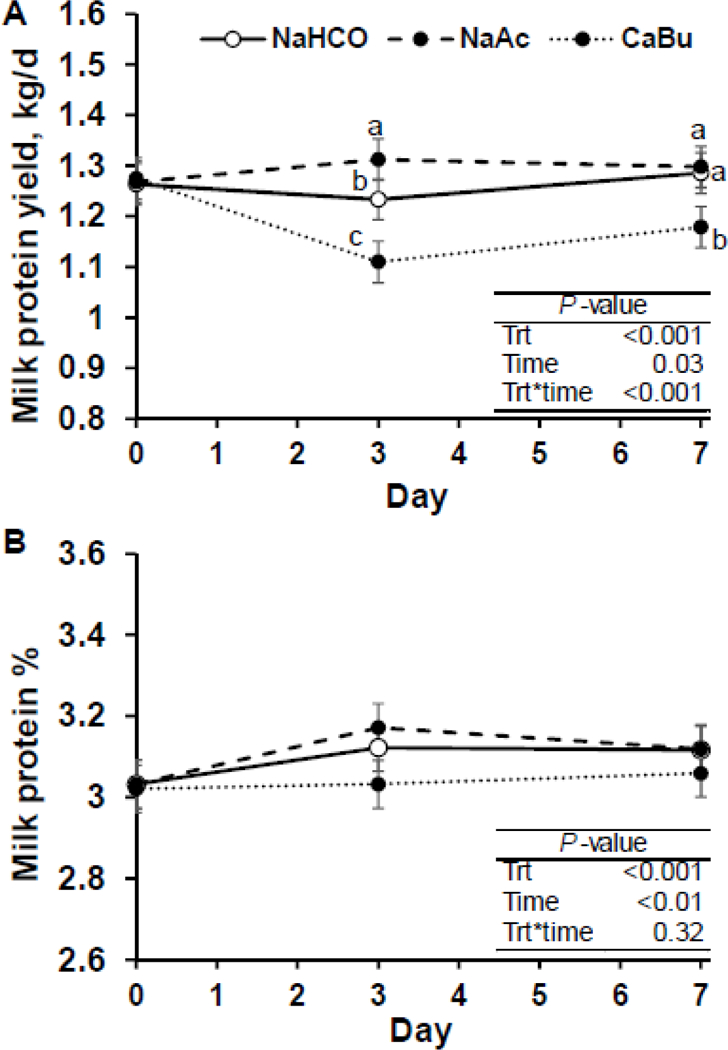
Figure 2.

Time course of milk protein yield (Panel A) and concentration (Panel B) of cows fed sodium bicarbonate at 3.2% of diet DM (control; NaHCO), sodium acetate at 2.9% of diet DM (NaAc), and calcium butyrate at 2.5% of diet DM (CaBu; equal carbon mass of NaAc; n = 12 per treatment). Least-square means and standard errors are shown and means that do not share a superscript differ within timepoint (P < 0.05).
