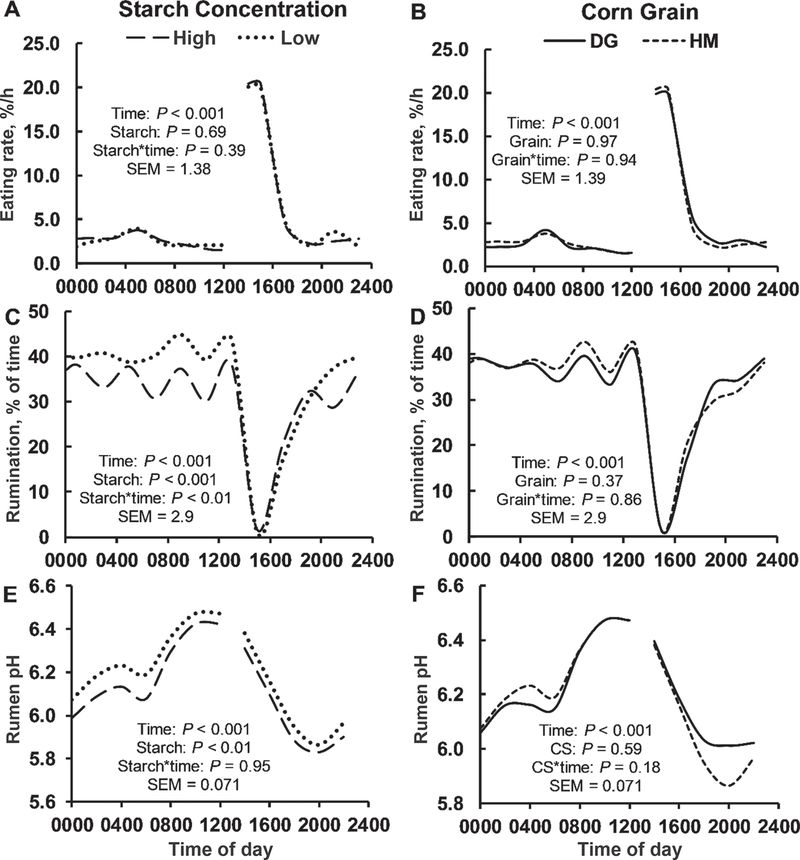
Figure 2.
Effect of starch source and level (experiment 2; Oba and Allen, 2003) on feed intake (A and B), rumination (C and D), and rumen pH (E and F). High = high starch concentration (32%); Low = low starch concentration (21%); DG = dry ground corn; and HM = high-moisture corn. The P-values for the main effects of time, starch concentration (Starch), and corn grain (Corn) and the interactions of time with either starch or corn grain and pooled SEM are reported in eac0h panel. Cows were fed 1×/d at 1400 h.

