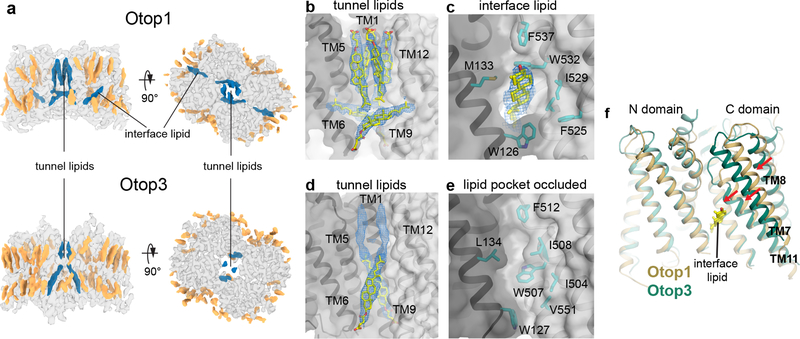
Figure 2. Lipid binding in Otop1 and Otop3.
a side (left) and top (right) views of cryo-EM map of Otop1 (top) and Otop3 (bottom). Protein density is transparent gray, annular lipid densities are colored gold, and lipid/cholesterol densities at the N domain-C domain intrasubunit interface and lipid tunnel are colored dark blue. b, densities (blue mesh, 3σ) corresponding to three CHS molecules (yellow and red sticks) in the lipid tunnel are apparent in Otop1. c, Density (blue mesh, 3σ) corresponding to a cholesterol molecule is also present at the intrasubunit interface. d, densities corresponding to a CHS molecule (blue mesh, 3σ) and an unassigned lipid (blue mesh, 3σ) are present in the Otop3 lipid tunnel. e, there is no lipid at the intrasubunit interface in Otop3, and the pocket is occluded. f, superimposition of Otop1 and Otop3 single subunits based on the N-domain shows that TM7, TM8, and TM11 of Otop3 is shifted relative to Otop1, likely due to absence of interface lipid.
(please relabel figure 2, so panel a, d are simply parts of panel a; otherwise, we’d have to rewrite the legend completely)

