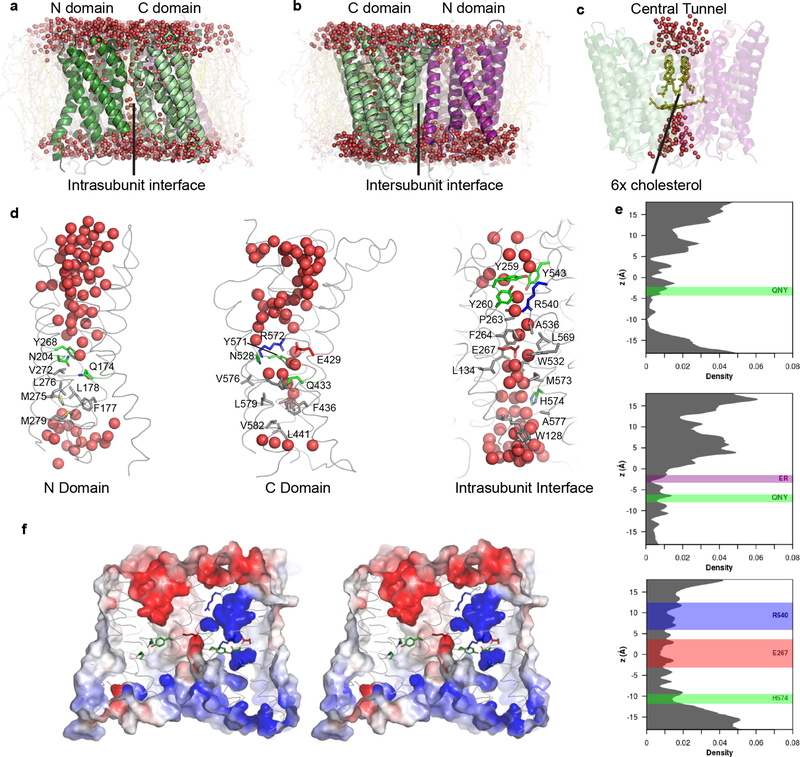
Figure 4. MD simulations reveal hydration of potential proton pathways in Otop1.
a–d, snapshots at the end of a 100-ns all-atom simulation (Supplementary Data Set 1, Run 3; d shows snapshots from subunit 1). A continuous presence of water is observed at the intrasubunit interface (a) but not at the intersubunit interface (b). c, cholesterol molecules in the central tunnel exclude water passage completely. e, the density distributions of water oxygen atoms along the three potential proton pathways, averaged across two subunits and three simulations. Positions of side chains noted in the text are drawn as rectangles, with the bounds representing μ ± 2σ. f, Electrostatic surface potential (contoured from −5 kT (red) to 5 kT (blue)) of the same snapshot in a–d and same view as a, in stereo representation. The surface is clipped ~15 Å from the front to highlight the potential along the putative pores. Highly negative potentials are found in the extracellular half of the N domain, and in the middle of the intrasubunit interface due to the conserved glutamic acid (E429). This is in contrast to the highly positive potential regions in the C domain.

