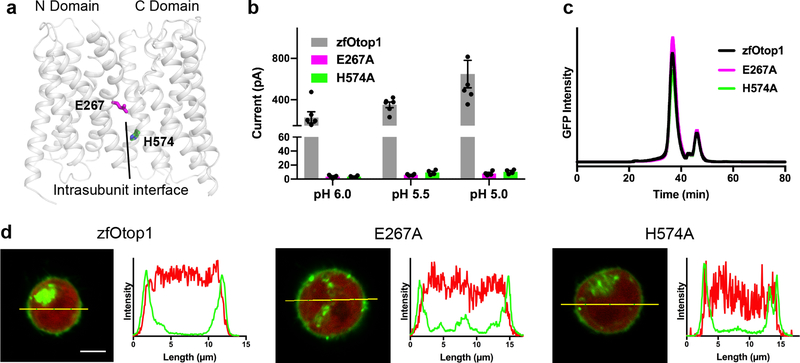
Figure 5. Mutation of charged residues at intrasubunit interface results in loss of function.
a, Cartoon model of a single subunit of zebrafish Otop1, with two charged residues (E267 and H574) at the intrasubunit interface shown as sticks. b, Current magnitude at various pH values in HEK-293 cells expressing N-terminally GFP fused zebrafish Otop1 (gray, n = 6), or its mutants E267A (magenta, n = 4) and H574A (green, n = 4), where n is the number of recorded cells. Individual data points, mean and s.e.m. are shown c, FSEC profiles of detergent-solubilized HEK-293 cells expressing the same constructs shown in b. d, confocal images (left panels) showing HEK-293 cells expressing tag-RFP and the Otop1 constructs shown in b, c. Each image is at the same scale, and scale bar (5 μm) is shown in the wild type image. Right panels show fluorescence intensity for GFP (green trace) and RFP (red trace) channels along the yellow line in the images.

