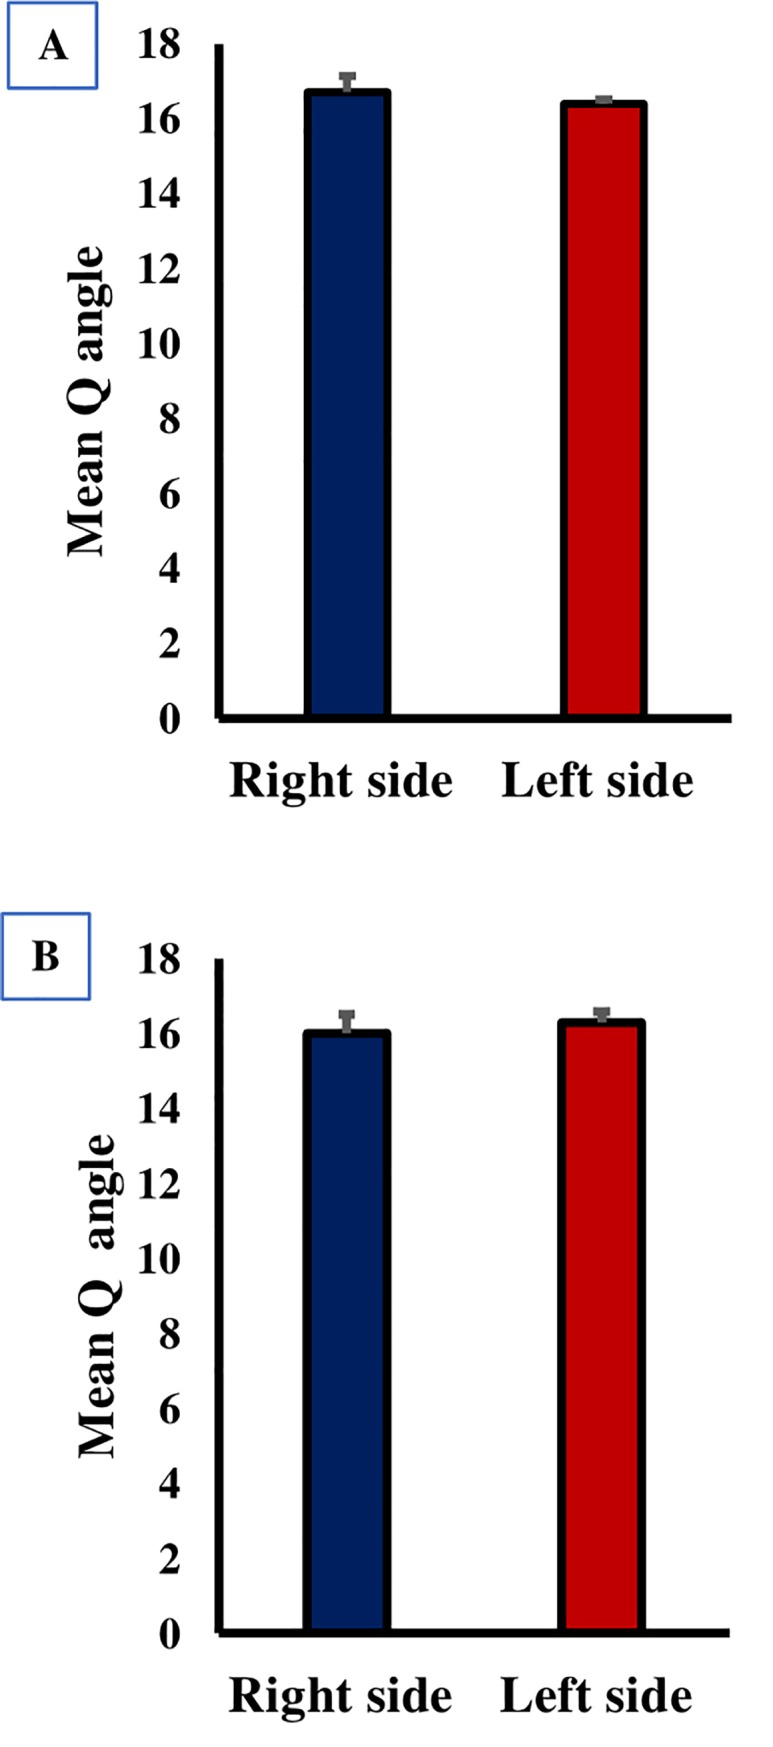
Fig 4. Variation of the Q angle with dominant side in adult population.

(A) right side dominant volunteers showed no significant differences. (B) left side dominant volunteer with the results displayed no significant difference. Each column represents the mean Q angle ± standard error of the mean (SE).
