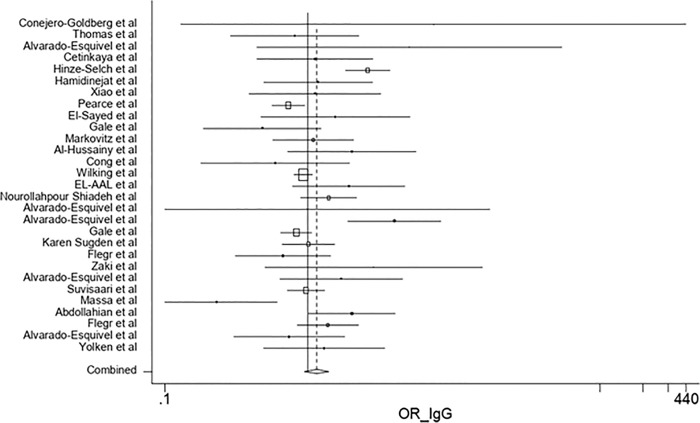
Fig 2. Forest plot diagram of studies showing IgG seropositivity rates of T. gondii.
Perpendicular discontinuous line indicates the odds ratio index. The perpendicular continuous line represents the null hypothesis. The horizontal lines illustrate 95% CI for ORs. A study that its confidence interval (horizontal line) interrupts the vertical continuous line (line null hypothesis), the odd ratio of this study is not statistically significant.

