
Figure 3. Ventromedial prefrontal cortex (vmPFC) and temporal-parietal junction (TPJ) activity is positively correlated with relative subjective value, while dorsomedial prefrontal cortex (dmPFC) activity is negatively correlated with relative subjective value.
(a) Whole-brain statistical parametric map for the positive (yellow) and negative (blue) correlation with relative subjective value, thresholded at p<0.05 FWE-corrected, cluster-defining threshold p<0.001, for the intertemporal (left) and risky (right) choice paradigms (sagittal section, x = 2). (b) Simple overlap between the statistical maps for the intertemporal and risky choice paradigms, including the positive (yellow) and negative (blue) correlation with relative subjective value (sagittal section, x = 2; coronal section, y = −28). (c,d) Extracted % signal changes for positive (left; yellow boxes; vmPFC ROI) and negative (right; blue boxes; dmPFC ROI) correlation with relative subjective value for the intertemporal (top) and risky (bottom) choice paradigms for Self and Other trials. Gray boxes indicate the corresponding % signal change for offline relative subjective value in the intertemporal choice task. Insets show 8 mm spherical ROIs for vmPFC (yellow) and dmPFC (blue) used to extract effect sizes. Data are plotted as box plots for each condition in which horizontal lines indicate median values, boxes indicate 25–75% interquartile range and whiskers indicate minimum and maximum values; data points outside 1.5x the interquartile range are shown separately as crosses. * indicates p<0.05, *** indicates p<0.005, all p>0.05 are explicitly stated. Significance was determined by comparison with either Wilcoxon signed rank or Friedman tests. N = 20 participants for intertemporal choice, N = 21 participants for risky choice.

Figure 3—figure supplement 1. Negative correlation with relative subjective value in Other over Self trials does not yield overlapping clusters between paradigms.

Figure 3—figure supplement 2. When recapitulating the methods of Nicolle et al. (2012), evidence is found for representation of offline subjective value in the posterior dorsomedial prefrontal cortex (dmPFC) in the intertemporal choice task.
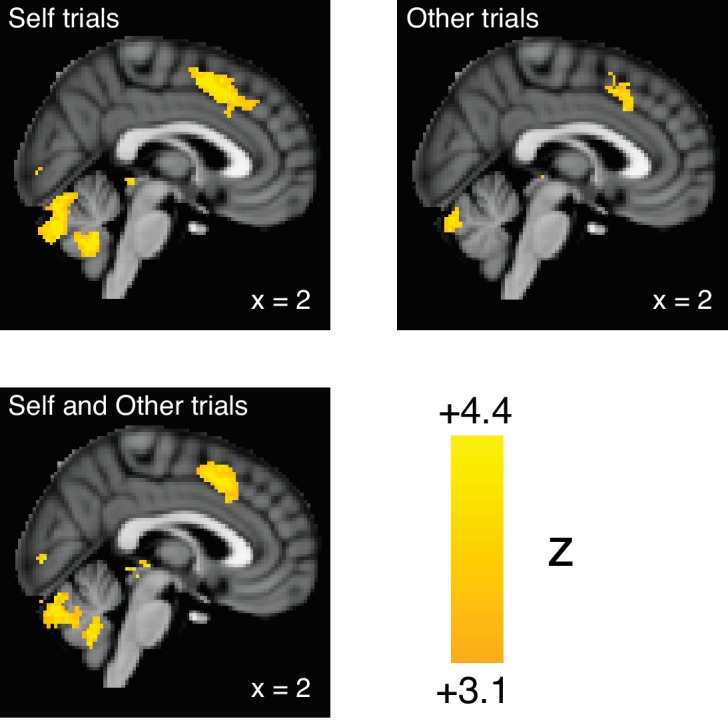
Figure 3—figure supplement 3. The absolute value of the chosen option is uncorrelated with activity in either the ventromedial prefrontal cortex (vmPFC) or dorsomedial prefrontal cortex (dmPFC).
