Figure 4.

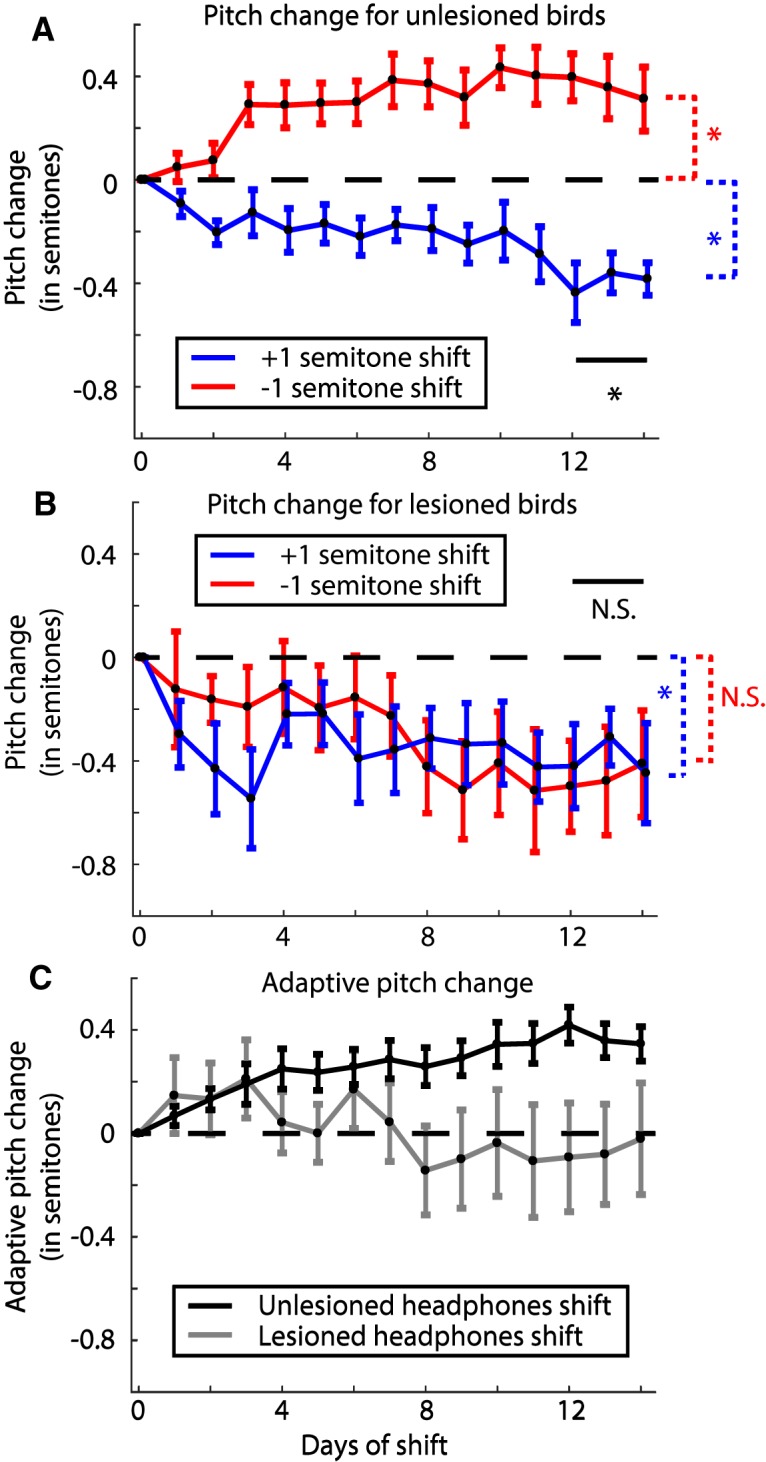
Change in pitch in response to pitch shift errors through the headphones in unlesioned and 6-OHDA lesioned birds. A, Change in pitch from baseline over the period of pitch shift for unlesioned birds broken up by the direction of introduced shift in pitch (data reanalyzed from Sober and Brainard, 2009). The graph shows that birds increase their pitch over time in response to a downward pitch shift (red trace; N = 3 birds) and decrease their pitch to an upwards pitch shift (blue trace; N = 3 birds). Traces for individual birds are shown in Extended Data Figure 4-1A. B, Same graph as in A quantified for 6-OHDA lesioned birds (N = 4 birds for each trace). Individual birds are shown in Extended Data Figure 4-1B. C, Adaptive change in pitch (see Results) for unlesioned birds (black trace; N = 6 birds) and 6-OHDA lesioned birds (gray trace; N = 8 birds). For A, B, the * and N.S. in black represent significant and not significant differences, respectively, between the two shift conditions, while the color coded differences check difference of each group from zero (see Results; Table 1).
