Figure 8.
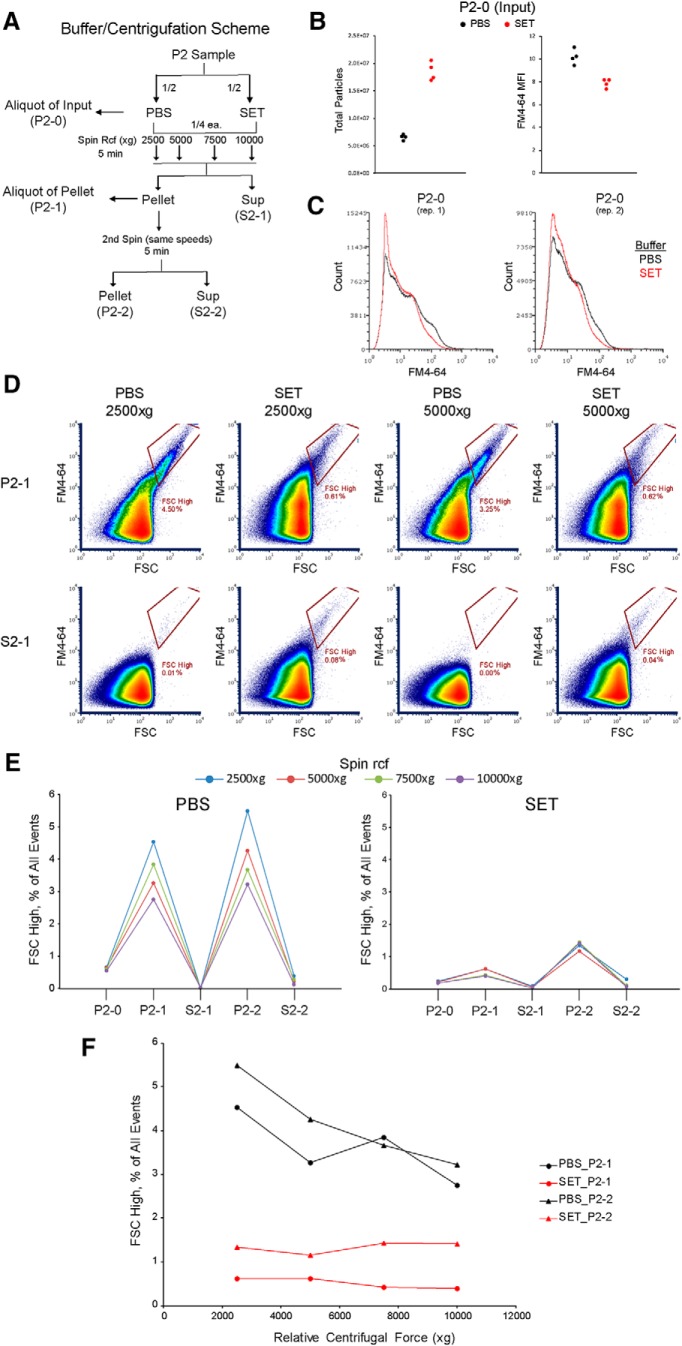
Effects of repeated centrifugation in different sample buffer on particle abundance and composition of P2 samples. These experiments were conducted using FM triggering on the Influx. A, Diagram of buffer/centrifugation scheme. A P2 sample resuspended in PBS or SET was aliquoted to measure input (P2-0), followed by two centrifugations for 5 min at the indicated relative centrifugal force (× g). An aliquot of the first pellet (P2-1) is reserved before the second spin. All samples are then analyzed by flow cytometry using absolute counting beads to measure particle number in each fraction. B, Input samples (P2-0) in PBS or SET buffer (n = 4 each). Left, Total particle counts. Right, Median fluorescence intensity of FM4-64 for all events. C, Representative histogram of FM4-64 fluorescence of all events for two replicate input samples (P2-0) in PBS and SET buffer. D, FSC versus FM4-64 density plots for P2-1 (top) or S2-1 (bottom) samples in PBS or SET buffer centrifuged at 2500 × g (left) or 5000 × g (right). FSC high gate corresponds to the top two FSC gates from Figures 6, 7. E, Gated FSC high events, expressed as % of all events, plotted for PBS (left) or SET (right) in each of five fractions moving through the centrifugation protocol at indicated relative centrifugal force (× g). Left to right in each panel, Input (P2-0), first pellet (P2-1) and supernatant (S2-1), second pellet (P2-2) and supernatant (S2-2). F, Gated FSC high events, expressed as % of all events, for P2-1 and P2-2 samples in PBS or SET at indicated relative centrifugal force (× g). See also Extended Data Figure 8-1.

