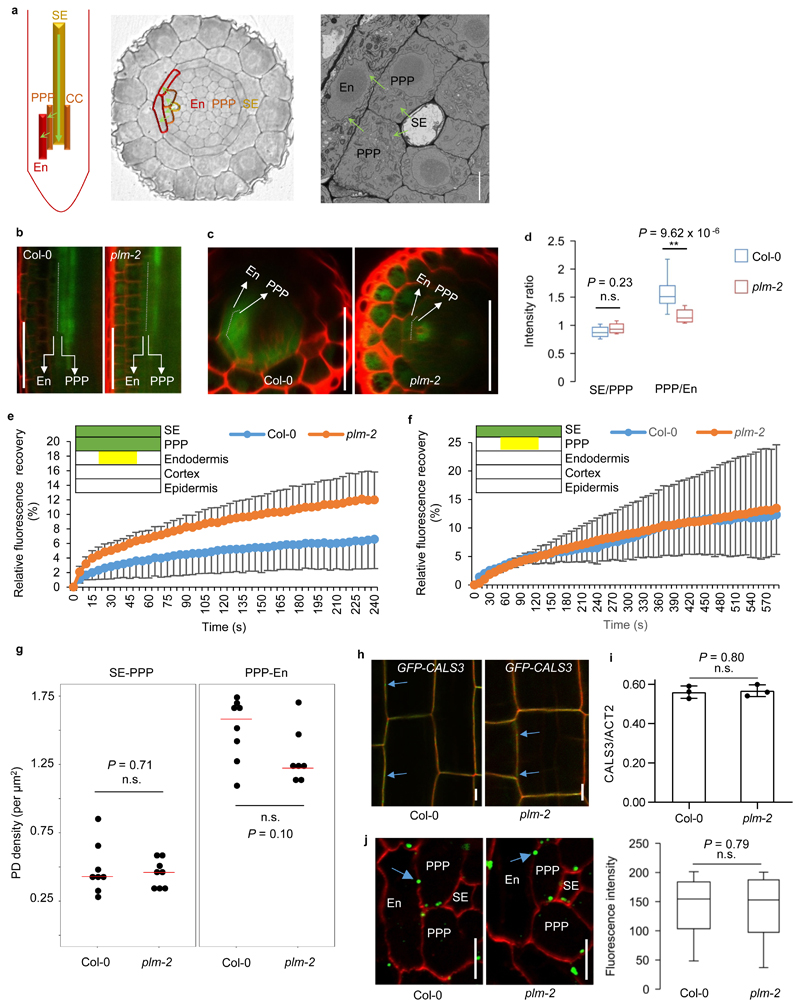
Figure 4. GFP unloading into root tip is enhanced in plm.
a. Schematic view of the unloading path of SE-PPP-endodermis in the root tip. b. GFP signals of PPP and endodermis at the unloading domains in the wild-type Col-0 and plm-2 roots. c. Optical cross sections of (b). The experiments of (b) and (c) were repeated five times independently with similar results. d. Fluorescence intensity ratios of SE/PPP and PPP/endodermis in the unloading domain (3 continuous cells since 200 μm away from QC post SE enucleation). n=13 (Col-0) and 11(plm-2) biologically independent plants. e. FRAP assay showing the recovery of GFP within the endodermis trafficking from PPP post bleaching of endodermis, cortex and epidermal layers in the unloading domain. The yellow box indicates the same region in endodermis described in (d) for GFP recovery assay. n=7 (Col-0) and 9 (plm-2) biologically independent plants. Data are means ± SD. f. FRAP assay showing the recovery of GFP within the PPP trafficking from SE post bleaching of PPP, endodermis, cortex and epidermal layers in the unloading domain. The yellow box indicates the same region in PPP described in (d) for GFP recovery assay. n=4 (Col-0 and plm-2) biologically independent plants. Data are means ± SD. g. Plasmodesmata density assay by SB-EM at the SE-PPP and PPP-endodermis interface in the same region of unloading domain in Col-0 and plm-2. The median values are indicated by red lines. n=8 (n=7 for plm-2 PPP-En) biologically independent samples. h. Localization of CALS3 (blue arrows) in Col-0 and plm-2. The experiment was repeated three times independently with similar results. i. Relative transcript levels of CALS3 in Col-0 and plm-2. Data are based on three independent replicate experiments. Data are means ± SD. j. Immunolocalization of callose at plasmodesmata (blue arrows) at the PPP-endodermis interface in the same region of unloading domain in Col-0 and plm-2. n=102 (Col-0) and 92 (plm-2) independent samples for quantification of fluorescence intensity. In the box plots of (d) and (j), the boxes indicate the first and third quartiles and the whiskers indicate the minimum and maximum values. The black lines within the boxes indicate the median values. Significant differences were determined by two-tailed Mann-Whitney-Wilcoxon test (d, j) and two-tailed two sample t-test (g, i). ** P<0.01. n.s., no significance. En, endodermis. Scale bars, 1 μm (a), 50 μm (b,c), 5 μm (h, j).

