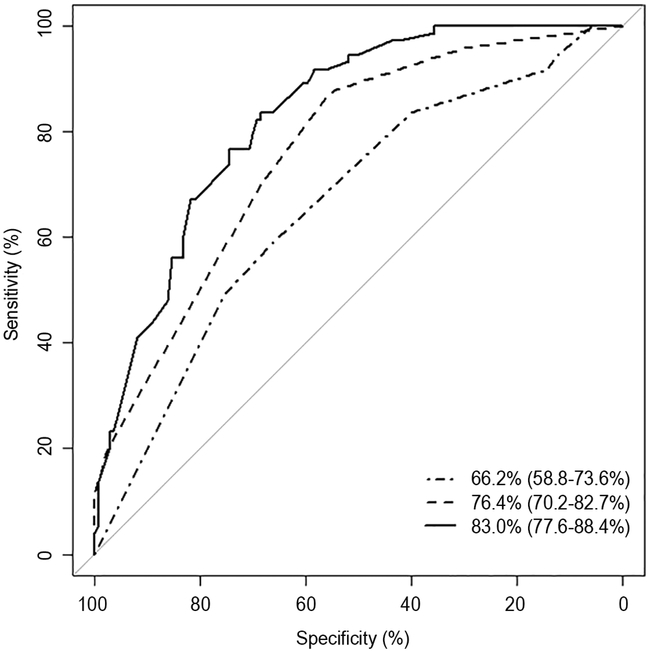
Figure 1: AUC curves for seizure prediction.
(A) Sensitivity and specificity of Model 1A-C
Figure 1 displays the area under the curve for each seizure prediction model with respective confidence intervals. The dot/dash line represents Model 1A (the clinical model alone), the dash lines represent Model 1B (EEG model alone) while the black line represents the Model 1C (combined EEG and clinical model). The x axis represents the specificity of each model. The y axis represents the sensitivity of each model.

